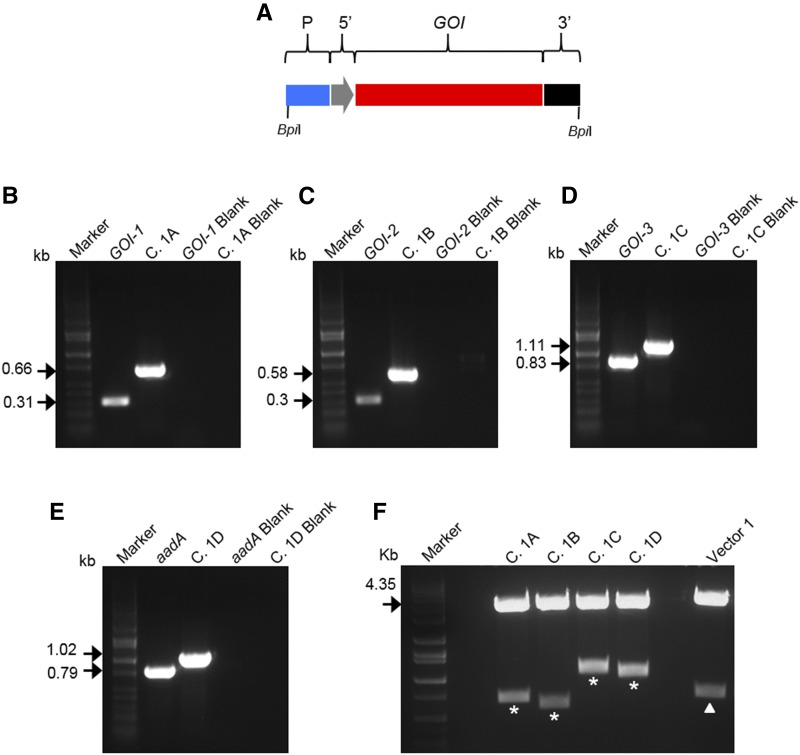
Figure 2.
Level-1 cloning for a four-gene operon-1. A, Schematic representation of a Level-1 cassette: promoter (P; blue); 5ʹUTR (5ʹ; gray); GOIs (GOI1–GOI3 or aadA; red); terminator/3ʹUTR (3ʹ; black). BpiI sites flanking the Level-1 cassette are indicated. B to E, PCR to confirm Level-1 assembly. Specific primers for the internal gene (B, GOI-1; C, GOI-2; D, GOI-3; E, aadA) and the promoter/3ʹUTR of cassettes 1A, 1B, 1C, and 1D (B, C. 1A; C, C. 1B; D, C. 1C; E, C. 1D) have been used. DNA bands at the predicted molecular mass (kb) confirm correct Level-1 assembly of all cassettes. Negative controls (blanks) of PCR images B to E are indicated. F, BpiI restriction digestion of Level-1 vectors. The four Level-1 cassettes released after digestion are indicated with asterisks (size indicated in Table 1). The empty vector 1 (vector position 1 forward) is used as a positive control. The LacZα fragment (0.616 kb) release after digestion of vector 1 is indicated with the triangle. The molecular mass (kb) of the backbone vector is indicated with black arrows. DNA markers are shown in each image.

