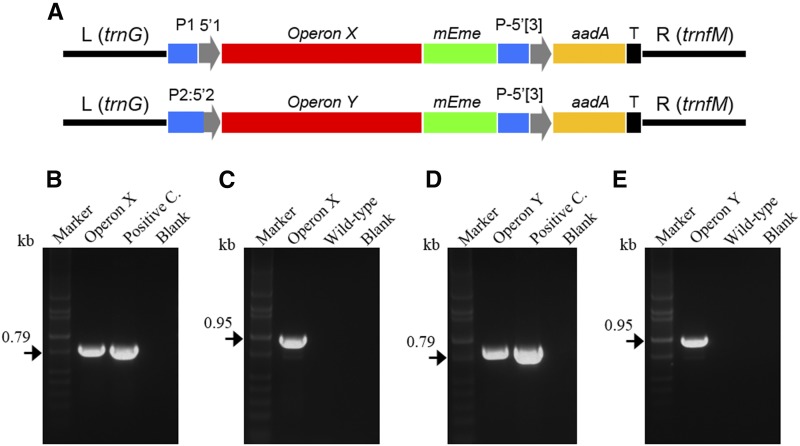
Figure 7.
Operon integration in the potato plastome. A, Schematic representation of chloroplast constructs: rrn promoter (P1) along with a synthetic RBS used as 5′UTR (5′1; blue and gray); promoter::5′UTR fusion of accD gene (P2:5′2; blue and gray); P-5′[3], promoter::5′UTR of the psbA gene (blue and gray); T, terminator/3′UTR of psbA gene (black); operon X and Y (red); mEme (mEmerald fluorescent marker; green); and aadA (3′-adenylyltransferase selection marker; yellow). The left (L; 1.17 kb) and right (R; 1.45 kb) arms homologous to the trnG/trnfM site of the potato plastome are indicated. B to E, PCR on total genomic DNA extracted from transplastomic green callus transformed with Operon X (B and C) or Operon Y (D and E). A pair of primers specific for the aadA gene (B and D) and aadA/trnfM (C and E) have been used to check correct operon integration. DNA bands at the predicted molecular mass confirm correct integration of both operons (kb; black arrows in B–E and black line in A). Positive and negative controls (blanks) along with potato wild-type samples and DNA markers are shown.

