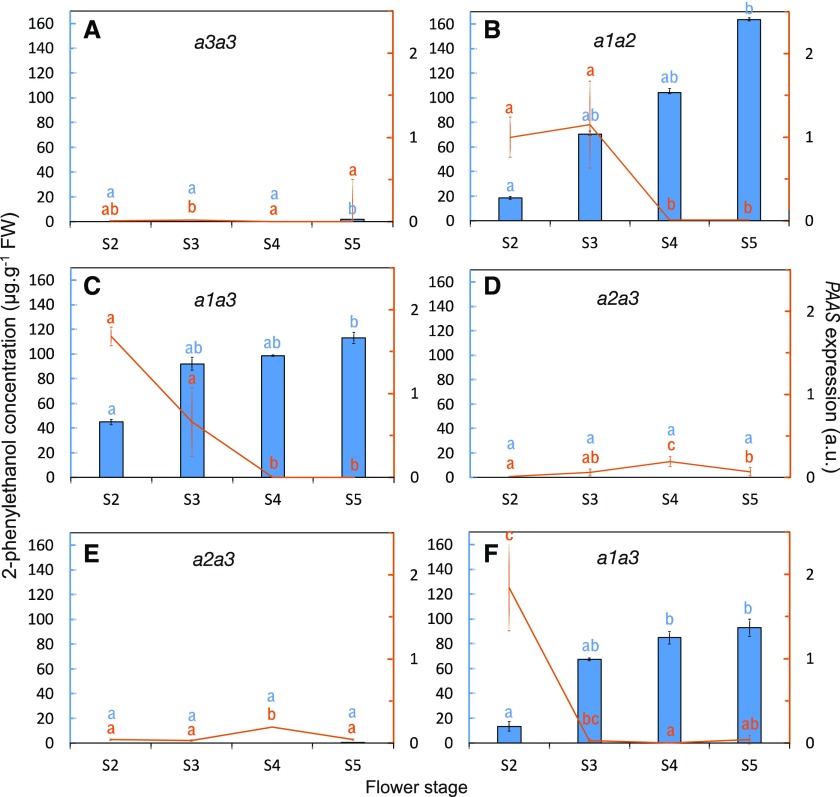
Figure 6.
2PE content analyzed by GC-MS (blue bars) and expression level of RhPAAS during flower development analyzed by RT-qPCR (orange lines) in the parents of the HW progeny, H190 (A) and Rw (B), and in four individuals of the progeny, HW24 (C), HW68 (D), HW149 (E), and HW530 (F). Flower developmental stages were defined by Bergougnoux et al. (2007). Transcript levels of RhPAAS were normalized to α-tubulin and EF1-α according to Dubois et al. (2011). Gene expression values are relative to the expression of Rw at flower stage 2, for which the value was set to 1. Error bars indicate se obtained from three independent biological replicates. Means with different letters (a, b, and c) are significantly different (Dunn’s test, P < 0.05). FW, Fresh weight; a.u., arbitrary units.

