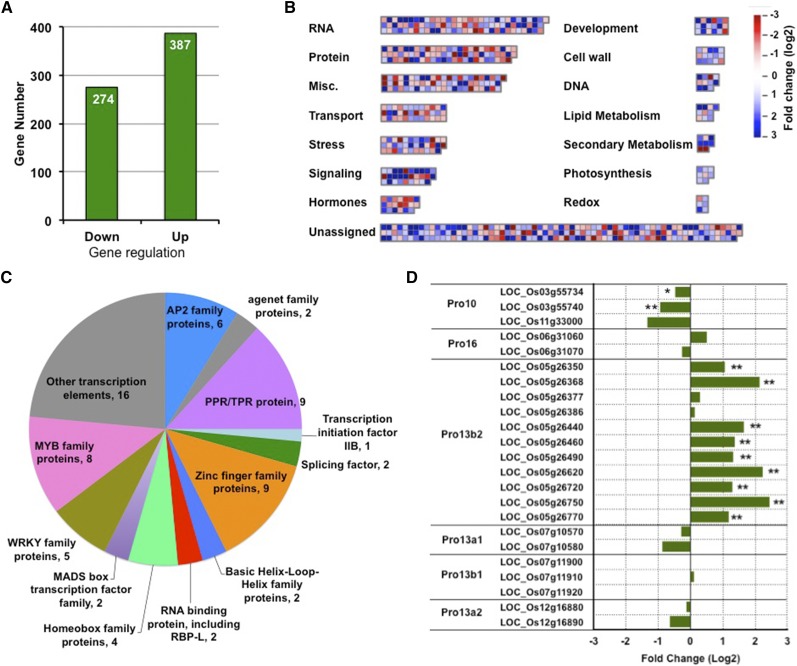
Figure 8.
Transcriptome changes mediated by knockdown of RBP-L expression. A, Chart showing the numbers of down- and up-regulated genes (log 2 fold change > 1, P value < 0.01) in rbpl developing seeds compared to that in wild-type. B, Distribution of molecular function and biological pathways that were enriched by the 661 DEGs in the rbpl line. C, Composition of the DEGs involved in RNA metabolic pathways. D, Fold changes on gene expression of prolamine family members. Prolamine genes with relative low RPKM (<1) were not analyzed and are not shown in the chart. *P value of two-tail t test < 0.05; **P value of two-tail t test < 0.01, based on RNA-seq data. Detailed information shown in this figure can be found in Supplemental Tables S2–S6.

