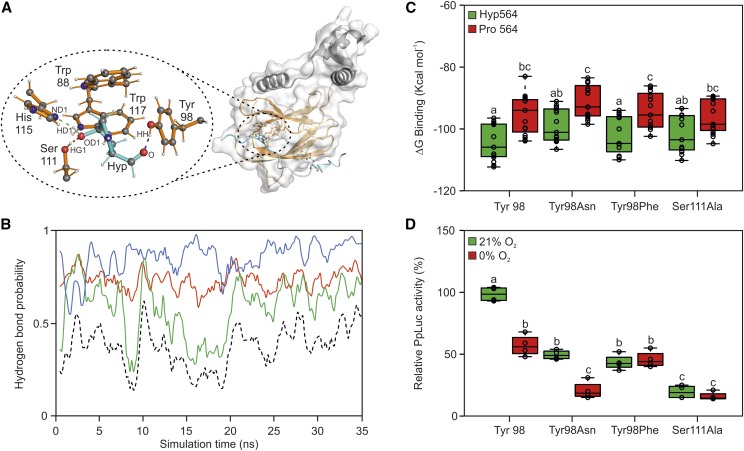
Figure 4.
Rational mutagenesis of sensor components to increase its responsiveness to anoxia. A, Crystal structure of HIF1⍺-CODD and pVHL (Hon et al., 2002). The HIF1⍺-CODD peptide and its residues are shown in cyan, the pVHL β-domain and its residues in orange, while the α-domain is shown in gray. The oval encloses a magnified view of the hydrogen bond network established between HIF1⍺-CODD and pVHL residues. Atomic names are given according to the Protein Data Bank nomenclature. B, MD simulation of the interactions between HIFHyp and pVHL His-115, Ser-111, and Tyr-98. Hydrogen bond probability involving the donor-acceptor pairs HD1Hyp-ND1His115 are shown in green, HG1Ser111-OD1Hyp in red, and HHTyr98-OHyp in blue. The black dotted line represents the hydrogen bond probability for all three bonds to be present. C, MM-GBSA calculations of interaction stability between wild-type HIF1⍺-CODD residue 564 and pVHL residues in the case of Tyr-98Asn, Tyr-98Phe, and Ser-111Ala mutations. Data are expressed as binding free energy (ΔG binding). D, Effects of individual pVHL point mutations on luciferase transactivation in Arabidopsis protoplasts. The average aerobic output for the wild-type pVHL peptide version (Tyr-98) was set to 100%. In the box plots, dots represent single data points, the black line marks the median, and the box indicates the interquartile range (IQR). Whiskers extend to data points that are lower than 1.5× IQR away from the box extremities. Different letters indicate statistical differences (P ≤ 0.05) calculated from two-way ANOVA followed by Tukey’s posttest.

