Figure 5.
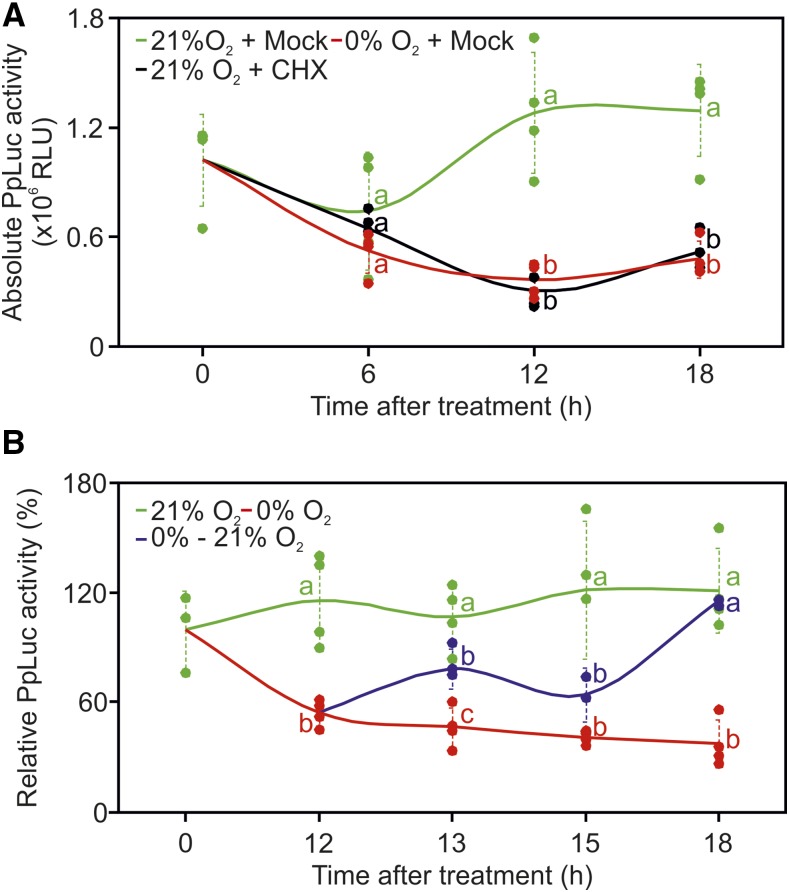
Characterization of sensor dynamics. A, Comparison of oxygen sensor output under aerobic conditions (21% O2 + Mock), in the absence of external oxygen (0% O2 + Mock), or in the case of protein synthesis inhibition by 100 μm CHX (21% O2 + CHX) in Arabidopsis protoplasts. Absolute luciferase activity was monitored at 6, 12, and 18 h after the onset of each condition. RLU, Relative luminescence units. B, Sensor output dynamics under reversible oxygen inputs. The 12-h anoxia-treated protoplasts were transferred back to aerobic conditions for 1, 3, or 6 h (blue line), and the output was compared with that produced by cells kept under continuous anoxia (red line) or fully aerated conditions (green line) for the same time span. The luminescence output was normalized to the signal corresponding to the initial time point, set to 100%. Dotted lines show sd (n = 4), and different letters indicate statistical differences (P ≤ 0.05) between treatments at each time point, as assessed by one-way ANOVA followed by Tukey’s posttest.

