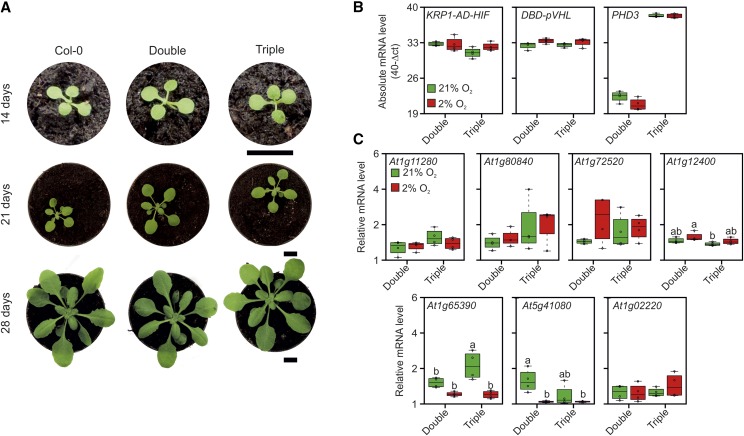
Figure 6.
Molecular and phenotypic consequences of the expression of the synthetic device. A, Phenotypical analysis of 2-, 3-, and 4-week-old Arabidopsis plants overexpressing KRP1-AD-HIF and DBD-pVHL in the absence (Double) or presence (Triple) of PHD3. Bars = 1 cm. B, Absolute mRNA levels for the three transgenes (KRP1-AD-HIF, DBD-pVHL, and PHD3) assessed by quantitative PCR (qPCR) in 3-week-old plants expressing two (Double) or three (Triple) modules and subjected to aerobic (21% O2) or hypoxic (2% O2) conditions for 12 h. C, qPCR assessment of expression levels of the genes identified as induced by the microarray analysis (Table 1; Supplemental File S1) in double or triple transgenic plants under aerobic (21% O2) or hypoxic (2% O2) conditions. In the box plots, dots represent single data points, the black line marks the median, and the box indicates the interquartile range (IQR). Whiskers extend to data points that are lower than 1.5× IQR away from the box extremities. Different letters indicate statistical differences (P ≤ 0.05) calculated from two-way ANOVA followed by Tukey’s posttest.

