Figure 7.
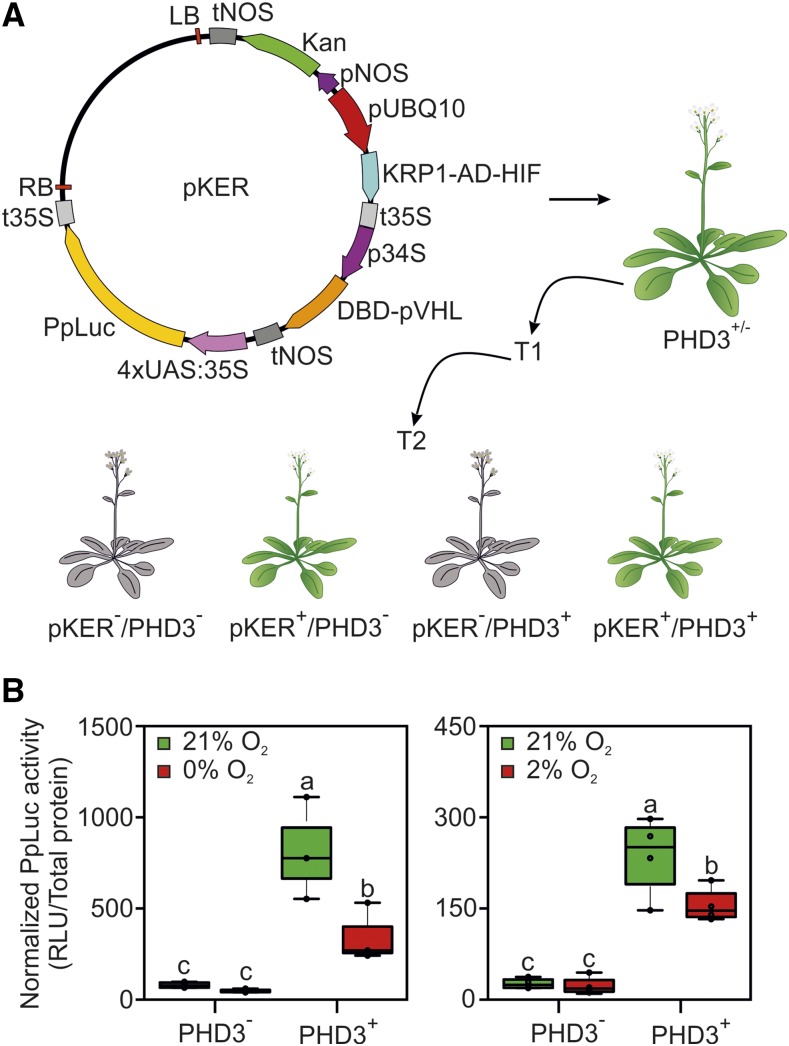
Responsiveness of the synthetic oxygen sensor stably expressed in Arabidopsis. A, Map of the T-DNA used to link the KRP1-AD-HIF, DBD-pVHL, and 4xUAS:35S:Luc expression cassettes. The construct was transformed into heterozygous 35S:PHD3 plants (PHD3+/−), and first-generation transgenic plants (T1) were selected on kanamycin for the presence of pKER (in the hemizygous state). From their offspring (T2), two genotypes of interest were isolated upon the independent segregation of the PHD3- and pKER-containing T-DNAs: pKER (pKER+/PHD3−) and pKER/PHD (pKER+/PHD3+), corresponding to the colored Arabidopsis plants. Sensor performance in one of the T2 populations produced is shown. B, Normalized firefly activity in pKER seedlings, stably expressing the effector components of the oxygen-responsive device, in the presence or absence of PHD3. Sensor output was recorded after 12-h treatments under complete anoxia (left) or 2% (v/v) oxygen (right). In the box plots, dots represent single data points, the black line marks the median, and the box indicates the interquartile range (IQR). Whiskers extend to data points that are lower than 1.5× IQR away from the box extremities. Different letters indicate statistically significant differences among means (P ≤ 0.05) calculated from two-way ANOVA followed by Tukey’s posttest. RLU, Relative luminescence units.

