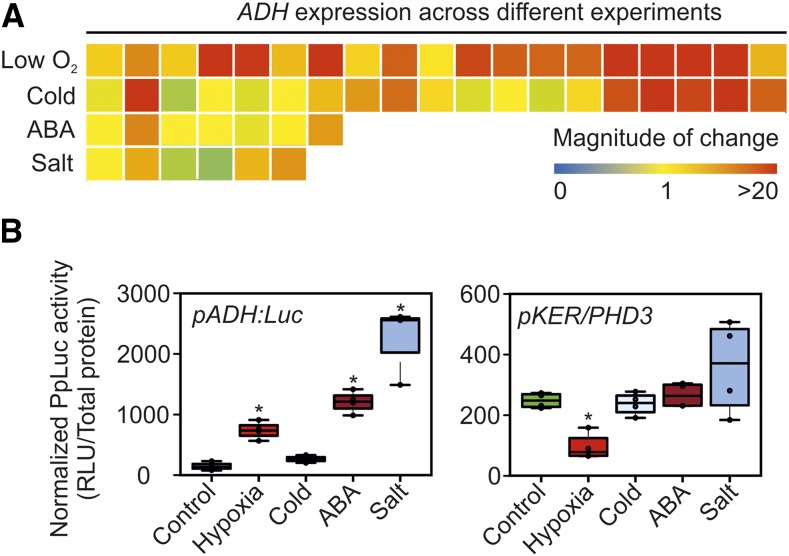
Figure 8.
Comparative responses of pADH:Luc and PHD3-positive pKER seedlings to abiotic stresses. A, Changes in ADH mRNA across different experiments, gathered with the aid of the Genevestigator reference expression database (Hruz et al., 2008) and listed in Supplemental File S2. B, Luminescent output of pKER/PHD3 pADH:Luc seedlings in response to four different abiotic treatments. In the box plots, dots represent single data points, the black line marks the median, and the box indicates the interquartile range (IQR). Whiskers extend to data points that are lower than 1.5× IQR away from the box extremities. Asterisks indicate statistically significant differences (P ≤ 0.05) from the mean of the control, calculated from one-way ANOVA comparison followed by Fisher’s lsd test. RLU, Relative luminescence units.

