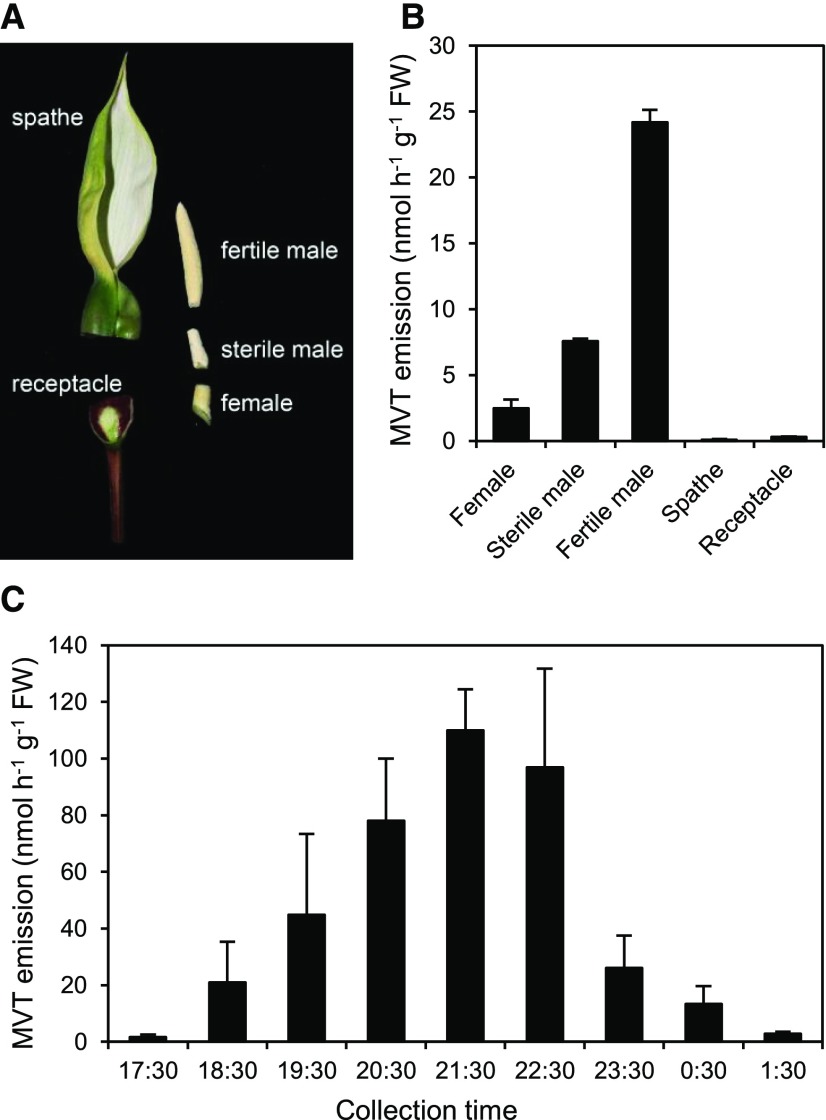
Figure 3.
MVT emission from C. bicolor inflorescences. A, Inflorescence dissection showing the parts tested for emissions. The female, sterile male, and fertile male flowers together comprise the spadix. B, MVT emission from inflorescence parts of cv ‘Pink Gem’. Data are means and SE for two biological replicates. Volatiles were collected for 2 h (19:30-21:30). C, Hourly MVT emission rates from sterile and fertile male flower tissue of cv ‘Tapestry’. Data are means and SE for three biological replicates. The x axis shows the start time for each 1-h collection period.

