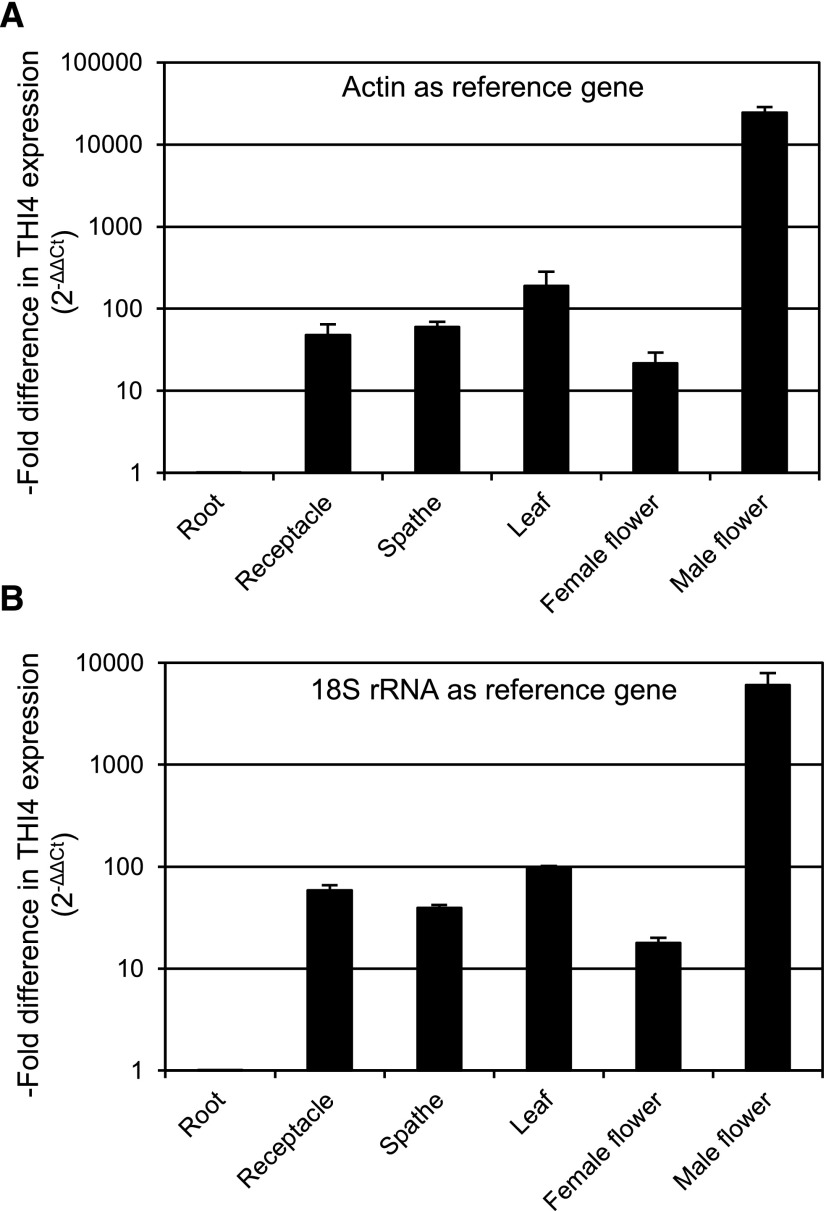
Figure 5.
RT-qPCR assay of THI4 mRNA levels in various organs of C. bicolor cv ‘Tapestry’. THI4 mRNA was quantified by the 2-ΔΔCT method. Data are presented as the -fold difference in THI4 gene expression in each organ normalized to the reference gene (actin or 18S rRNA) and relative to roots (= 1.0). Inflorescence tissues were harvested on Day 0, just before the MVT emission burst started. Data are means and SE of three biological replicates. Note that the y axis scale is logarithmic.

