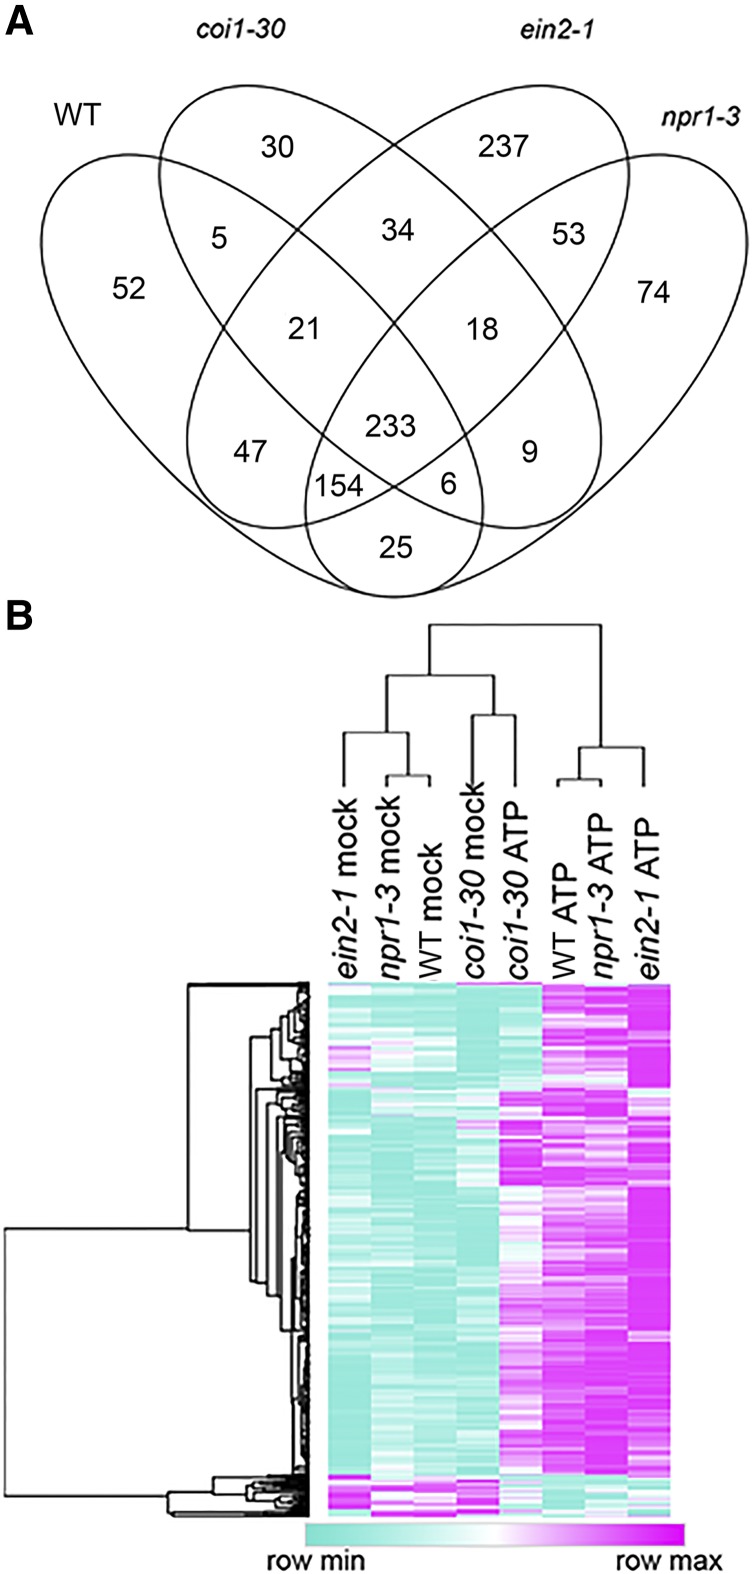
Figure 4.
Overview of ATP-responsive gene expression in the wild type and coi1-30, npr1-3, and ein2-1 mutants. A, Overlap between ATP-responsive gene expression in the indicated genotypes 30 min after treatment with 500 µm ATP. B, Hierarchical clustering of average expression [log2(cpm+1)] for 543 genes identified as ATP responsive in the wild type (WT). Rows and columns were clustered by 1 − Pearson correlation using the Morpheus online tool (https://software.broadinstitute.org/morpheus), and the tree was drawn using average linkage.

