
Figure 1.
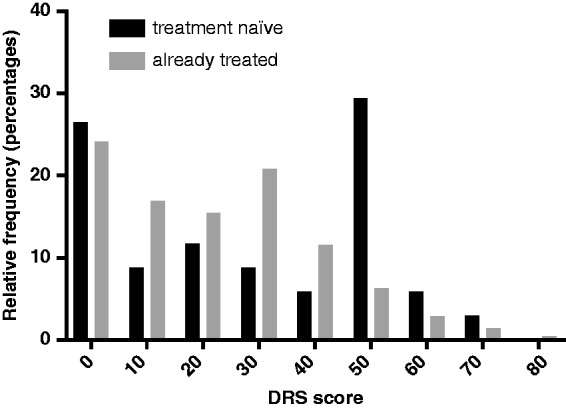
The DRS scores patients who are treatment naïve versus those who were on of who had been on treatment.
There is a significant difference between the distributions of DRS scores in the treatment-naïve cohort (n = 36, three questionnaires not completed) versus those who were or who had been on treatment (n = 215, three questionnaires not completed) (Kolomogorov–Smirnov test, p = 0.027).