
Figure 3.
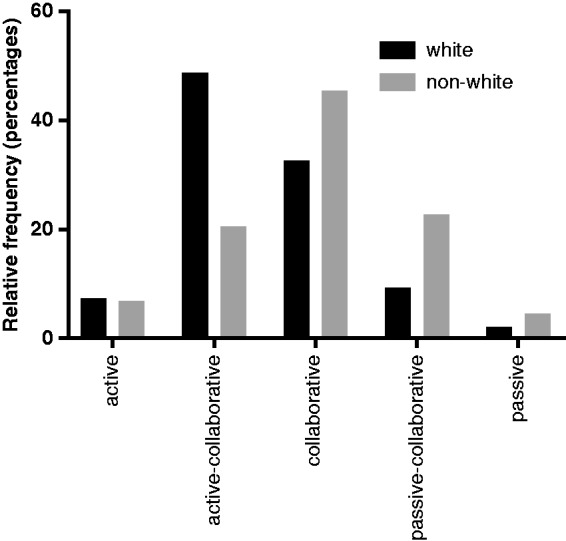
Distribution (% of total) for each category of the CPS score from the total population. Non-white ethnicity scored significantly higher CPS scores (representing a passive role) compared with white ethnicity (Kolomogorov–Smirnov test, p=0.006).