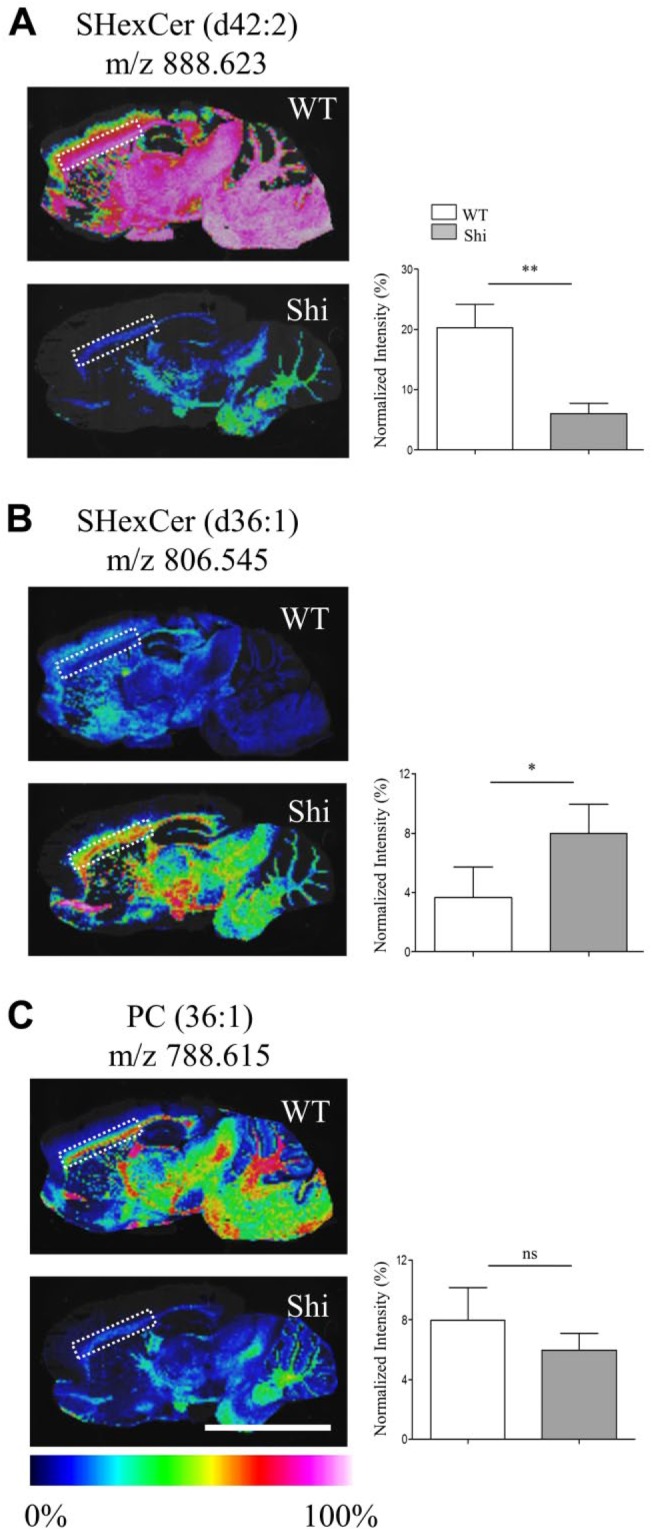
Figure 1.

Changes in the spatial distribution of SHexCer and PC species within white matter regions like the CC of Shi mouse brain. (A–C) Normalized MS images of SHexCer (d42:2), SHexCer (d36:1), and PC (36:1), respectively. The spatial distribution of SHexCer (d42:2) and PC (36:1) was reduced in the Shi mouse brain compared with the WT in myelin enriched white matter regions like the CC; whereas, spatial distribution of SHexCer (d36:1) was increased within the affected regions. Lipid annotation and the corresponding m/z are listed above each image. Charts next to each image show normalized intensities (plotted as %) calculated from the selected ROI in the CC (dashed outline in each image). The normalized intensities of SHexCer (d42:2) were significantly decreased; whereas, there was a nonsignificant reduction in the normalized intensities of PC (36:1) in the CC of the Shi mouse compared with WT mouse. Normalized intensities of SHexCer (d36:1) were significantly increased in the Shi mouse compared with WT mouse (n=5, five Shi mice and five WT mice animals were evaluated; unpaired two-tailed t-test; spatial resolution, 80 μm; and scale bar, 5 mm). Abbreviations: CC, corpus callosum; Shi, shiverer; MS, mass spectrometry; SHexCer, sulfatide; PC, phosphatidylcholine; WT, wild type; ROI, region of interest. *p<0.05, **p<0.01.
