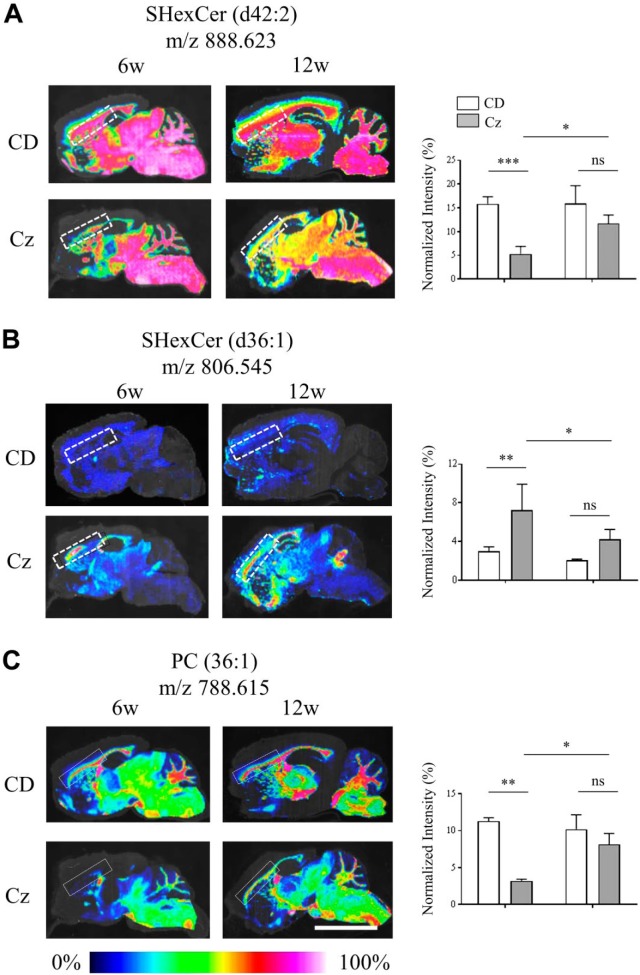
Figure 2.
Altered spatial and temporal distribution of SHexCer and PC species in the CC of the Cz-fed mouse. (A–C) Normalized MS images of SHexCer (d42:2), SHexCer (d36:1), and PC (36:1), respectively. Shown in each panel are the MS images acquired from sagittal brain sections collected from CD-fed mouse (upper row) and Cz-fed mouse (bottom row) at 6w (demyelination) and 12w (remyelination) study time points. Compared with the CD-fed mouse, the spatial distribution of SHexCer (d42:2) and PC (36:1) was reduced within the CC (dashed outline) of Cz-fed mouse after 6w demyelination; whereas, the spatial distribution SHexCer (d36:1) was increased within the affected areas of the CC. Spatial distribution changes of all three lipid species restored albeit not completely during remyelination (12w) in the CC of Cz-fed mouse. Lipid annotation and the corresponding m/z are listed above each image. Charts next to each image show normalized intensities (plotted as %) calculated from the selected ROI in the CC (dashed outline in each image). Normalized intensities of SHexCer (d42:2) and PC (36:1) were significantly lower after the 6w Cz-feeding indicating their reduced tissue levels compared with the CD-fed mouse. Alternatively, normalized intensities of SHexCer (d36:1) were significantly elevated after the 6w Cz-feeding indicating a rise in their tissue levels compared with the CD-fed mouse. The ion intensities restored at 12w although not completely but significantly compared with the 6w Cz-fed mouse. Intensities of the Cz-fed mouse were not significantly different compared with the CD-fed mouse at 12w (n=4, four Cz-fed mice and four CD-fed mice were evaluated per time point; two-way ANOVA; spatial resolution, 80 μm; and scale bar, 5 mm). Abbreviations: CC, corpus callosum; Cz, cuprizone; MS, mass spectrometry; SHexCer, sulfatide; PC, phosphatidylcholine; ROI, region of interest; CD, chow diet; w, weeks. *p<0.05, **p<0.01, ***p<0.001.

