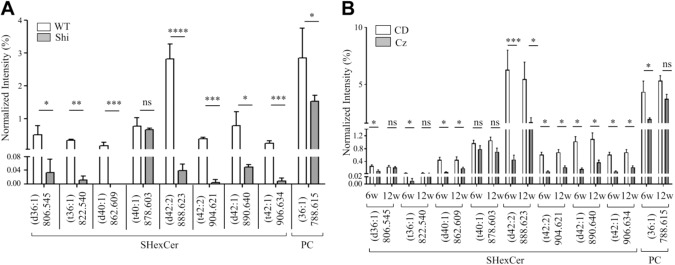
Figure 6.
LC-ESI-MS analysis confirmed the reduced abundance of SHexCer and PC species in the CC of Shi mouse brain and upon Cz-induced demyelination but no lipid species were elevated. (A) LC-ESI-MS-derived normalized intensities (plotted as %) for SHexCer (d40:1), SHexCer (d42:2), SHexCer (t42:2), SHexCer (d42:1), SHexCer (t42:1), and PC (36:1) were significantly decreased in the Shi mouse. Normalized intensities of SHexCer (d36:1) and SHexCer (t36:1) were also significantly decreased in the Shi mouse. There was no significant difference in intensities of SHexCer (t40:1) between the Shi and WT mouse. Unpaired two-tailed t-test, five animals of each genotype were evaluated. (B) LC-ESI-MS-derived normalized intensities (plotted as %) for SHexCer (d40:1), SHexCer (d42:2), SHexCer (t42:2), SHexCer (d42:1), SHexCer (t42:1), and PC (36:1) were significantly decreased after 6w in Cz-treatment. Intensities of all these lipid species partially restored at 12 weeks after removal of Cz from the diet. Normalized intensities of SHexCer (d36:1) and SHexCer (t36:1) were reduced after 6w of Cz-feeding but the intensities these lipid species completely restored by 12w. There was a small reduction in the intensities of SHexCer (t40:1) in the Cz-fed mouse at both 6w and 12w but the intensities were not significantly different compared with the age-matched CD-fed mouse. Two-way ANOVA, five to eight animals of each type were analyzed per time point. Abbreviations: LC-ESI-MS, liquid chromatography–electrospray ionization–mass spectrometry; CC, corpus callosum; Shi, shiverer; Cz, cuprizone; SHexCer, sulfatide; PC, phosphatidylcholine; WT, wild type; CD, chow diet; w, weeks. *p<0.05, **p<0.01, ***p<0.001, ****p<0.0001.

