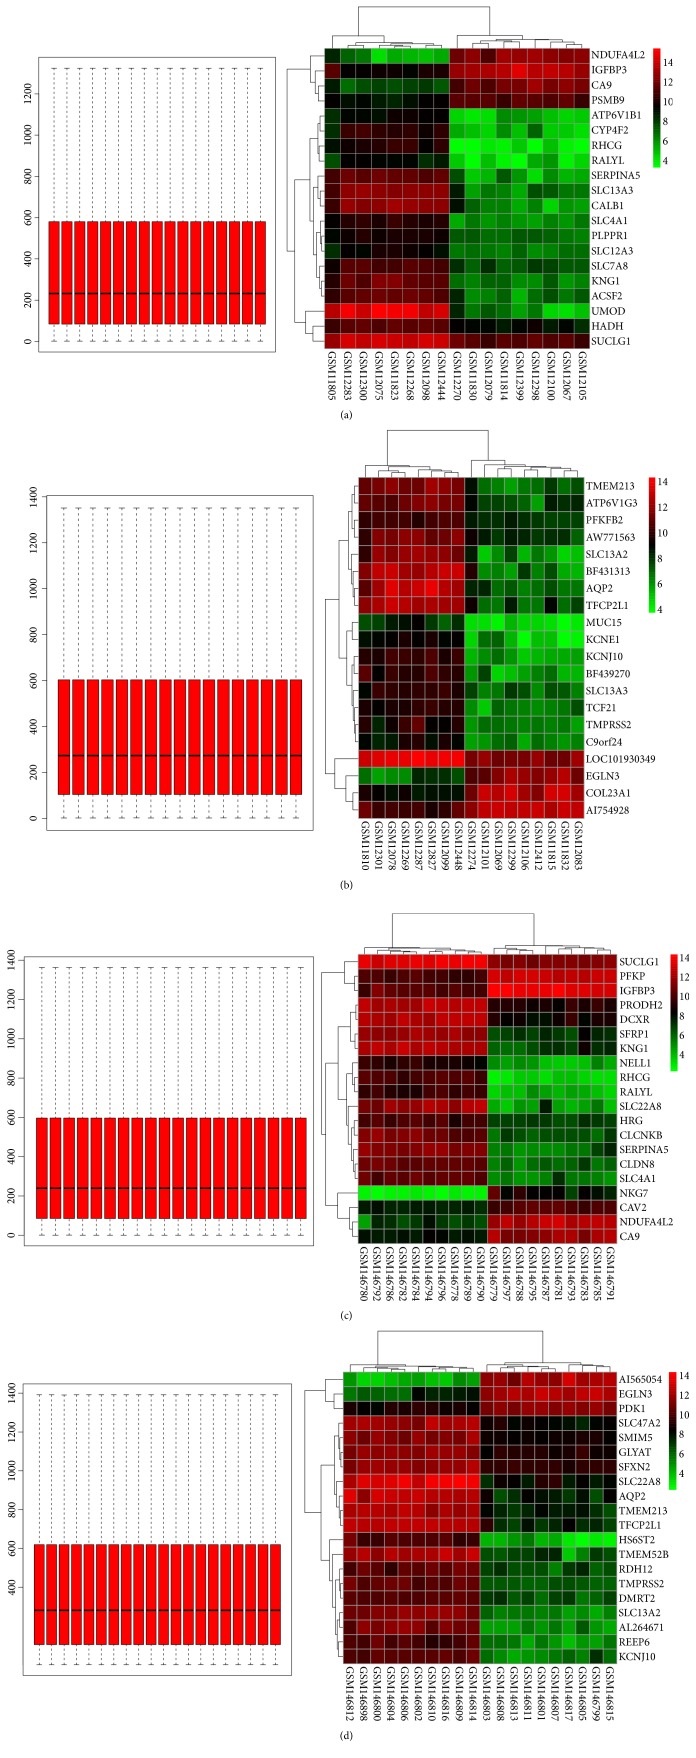
Figure 2.
The normalization and cluster heatmaps of the top 20 DEGs in each dataset. (a) The normalization and cluster heatmaps of the top 20 DEGs in GDS505. (b) The normalization and cluster heatmaps of the top 20 DEGs in GDS507. (c) The normalization and cluster heatmaps of the top 20 DEGs in GDS2880. (d) The normalization and cluster heatmaps of the top 20 DEGs in GDS2881.

