Figure 4.
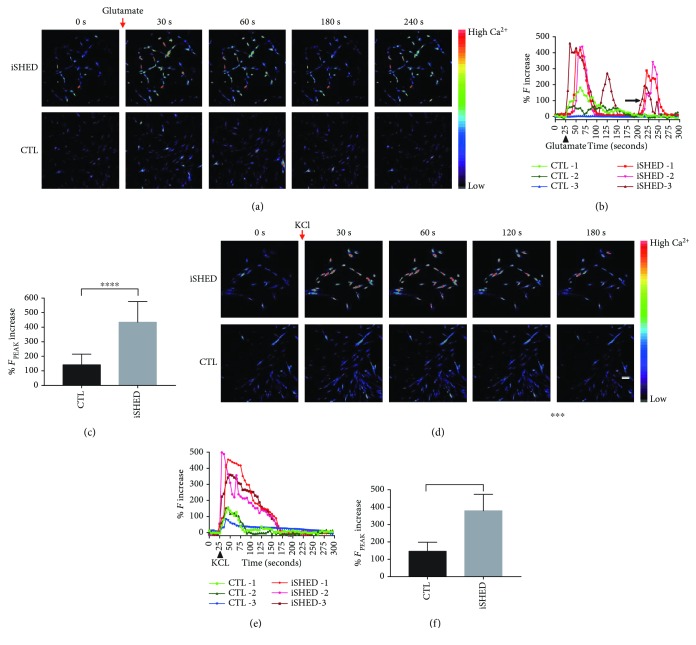
Ca2+ activity of SHEDs on day 0 (control, CTL) and day 24 (iSHEDs). (a, d) Representative pseudo-color images showing a greater fluorescence increase in induced cells than in controls after exposure to glutamate (a) and high K+ (d) (color code denotes Ca2+ level). (b, e). Representative Ca2+ transient profiles with time displaying higher Ca2+ influx peaks in the induced cells than in the controls ((b) for glutamate, (e) for KCl); the arrow indicates second or third Ca2+ influx peaks in induced SHEDs (b). (c, f) Histograms showing the fluorescence intensity at the peak time was higher in the induced cells than in controls ((c) for glutamate, (f) for KCl) (∗∗∗ p < 0.001 and ∗∗∗∗ p < 0.0001).

