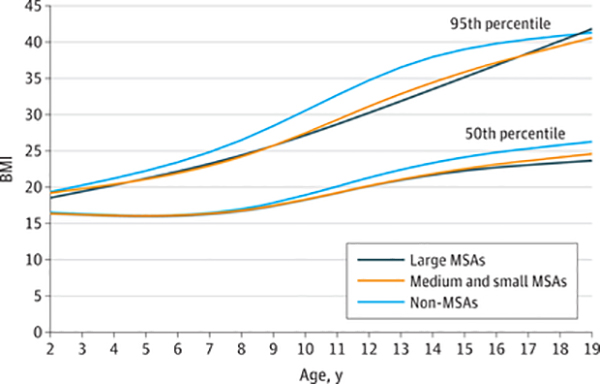
Figure. Smoothed 50th and 95th BMI Percentiles Among US Youth Aged 2 to 19 Years by Urbanization Category and Age, 2013–2016.
BMI indicates body mass index (calculated as weight in kilograms divided by height in meters squared); MSA, metropolitan statistical area. Estimates are weighted. Data source: National Health and Nutrition Examination Survey.

