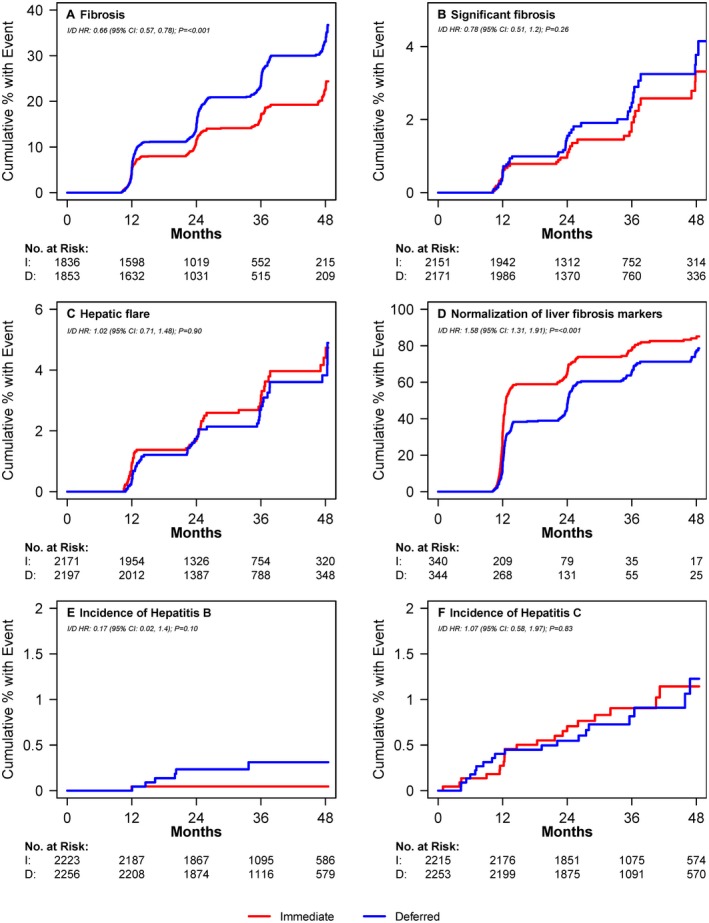
Figure 2.

Cumulative proportion of patients with liver‐related outcomes over time from randomization by treatment arm. (A) Proportion of participants developing elevated fibrosis score (APRI > 0.5 or FIB‐4 > 1.45) over time. Number at risk = those with no fibrosis at baseline based on availability of measurements at visits. (B) Proportion of participants developing significant fibrosis (APRI > 1.5 or FIB‐4 > 3.25) over time. Number at risk = those with no significant fibrosis at baseline based on availability of measurements at visits. (C) Proportion of participants developing hepatic flare over time. Hepatic flare was defined as ALT greater than five times the upper limit of normal (30 for men and 19 for women). Number at risk = those with no hepatic flare at baseline and follow‐up ALT measurements available. (D) Proportion of participants with normalization of abnormal baseline APRI and FIB‐4 scores (i.e., APRI > 0.5 or FIB‐4 > 1.45 normalizing to APRI ≤ 0.5 and FIB‐4 ≤ 1.45) over time. Number at risk = those with abnormal scores at baseline and availability of at least one follow‐up measurement. I Proportion of participants developing hepatitis. Number at risk = number who tested negative for Hepatitis B at baseline. (F) Proportion of participants developing hepatitis C over time. Number at risk = number who tested negative for hepatitis C at baseline. I, immediate treatment arm; D, deferred treatment arm; HR, hazard ratio; CI, confidence interval.
