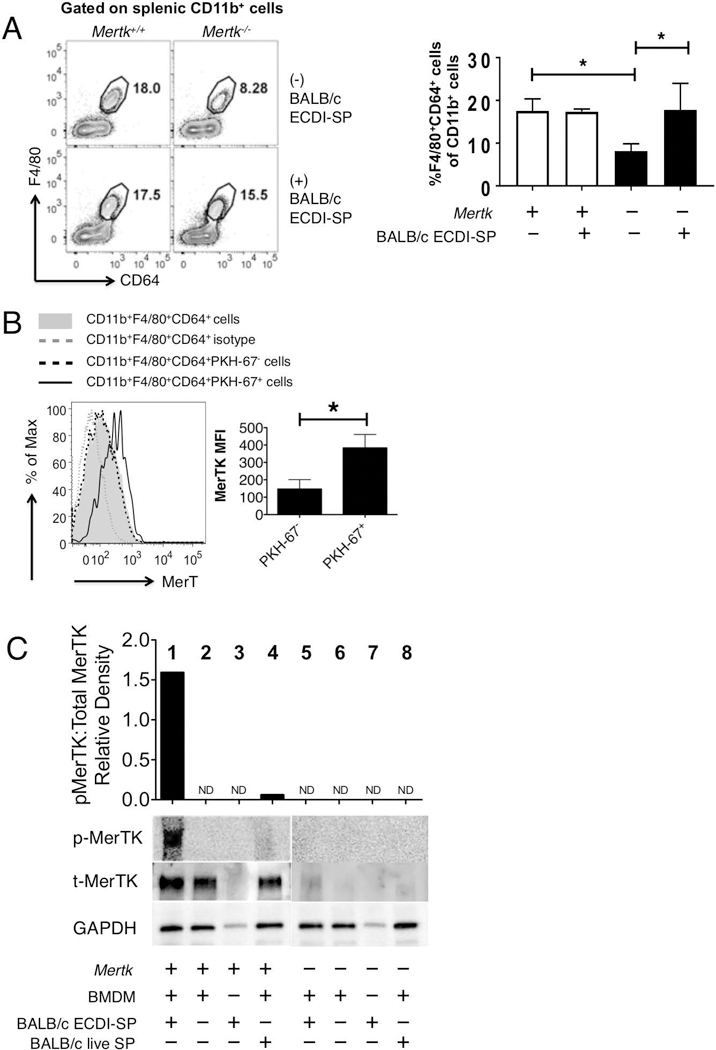
Figure 2. MerTK is activated in response to ECDI-SPs.

(A) Total splenic macrophages (CD11b+F4/80+CD64+) in Mertk+/+ and Mertk−/− at baseline and 4 days after allogeneic ECDI-SP injection. Left: representative FACS contour plots; Right: bar graph showing average percentages of splenic CD11b+F4/80+CD64+ among total CD11b+ cells in various conditions. Data for (A) were obtained and averaged from three animals per group from one experiment. Statistical significance was determined using t test. *P ≤ 0.05. (B) MerTK expression on Mertk+/+ splenic macrophages engulfing allogeneic ECDI-SP. BALB/c ECDI-SP were labeled with PKH-67 to allow differentiation of splenic macrophages engulfing ECDI-SP from those that had not. Total splenic macrophages (CD11b+F4/80+CD64+) were analyzed. Isotype was used as negative control. Bar graph shows averaged MerTK mean fluorescence intensity (MFI) on PKH-67+ vs. PKH-67− splenic macrophages. Data for (B) were obtained and averaged from a total of six animals per group from three independent experiments. Statistical significance was determined using t test. *P ≤ 0.05. (C) Western blot analyses of phosphorylated MerTK (p-MerTK), total MerTK (t-MerTK) and GAPDH, in BMDM alone, or following 5-hr co-culturing with either BALB/c ECDI-SP or BALB/c live SP. Lanes 1–4: BMDMs from Mertk+/+ mice; lanes 5–8: BMDMs from Mertk−/− mice. BMDMs from Mertk−/− mice were shown as a negative control. Top bar graph shows densitometry quantification of relative density of p-MerTK and t-MerTK. Data shown in (C) is representative of three independent experiments.
