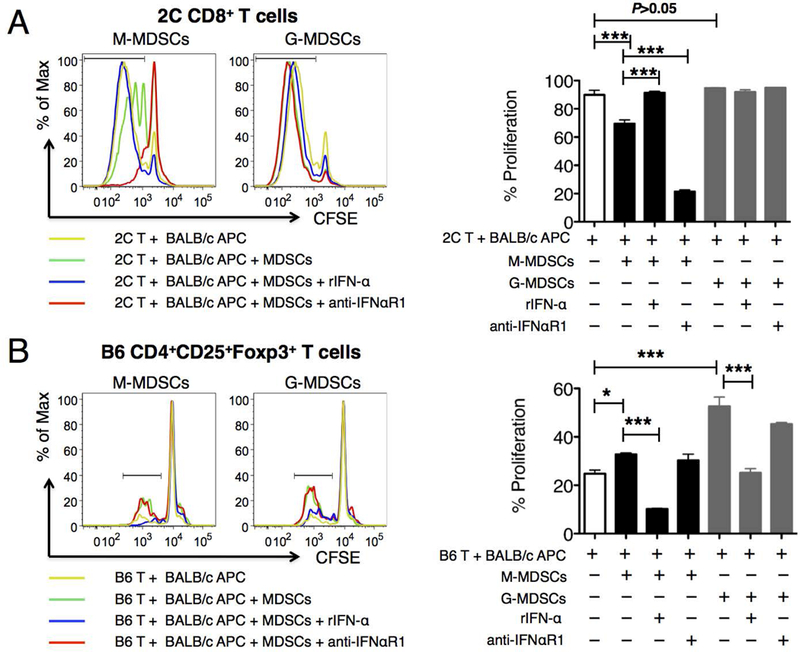
Figure 6. MDSC function is compromised by the inflammatory cytokine IFN-α.

(A) 2C CD8 T cell proliferation to BALB/c stimulation was measured by CFSE dilution in MLRs set up as described in Methods. In some cases, MACS sorted splenic M-or G-MDSCs from B6 mice were added to the MLRs to determine their suppression of 2C T cell proliferation. In additional cases, rIFN-α (1000 U/ml) or anti-IFNaR1 (20 mg/ml) was further added to the cultures to determine their effects on the MDSC-mediated suppression of 2C proliferation. Representative histograms were gated on 2C CD8+ T cells. Percentage of proliferation in the right bar graph was calculated as (2C CD8+ T cells with diluted CFSE)/(total 2C CD8+ T cells). (B) B6 CD4+CD25+Foxp3+ Treg proliferation to BALB/c stimulation was measured by CFSE dilution in MLRs set up as described in Methods. In some cases, MACS sorted splenic M-or G-MDSCs from B6 mice were added to the MLRs to determine their effect on CD4+CD25+Foxp3+ Treg proliferation. In additional cases, rIFN-α or anti-IFNaR1 was further added to the cultures to determine their effects on the MDSC-mediated promotion of CD4+CD25+Foxp3+ Treg proliferation. Representative histograms were gated on CD4+CD25+Foxp3+ Tregs. Percentage of proliferation in the right bar graph was calculated as (CD4+CD25+Foxp3+ Tregs with diluted CFSE)/(total CD4+CD25+Foxp3+ Tregs). Data for (A-B) were obtained and averaged from three independent experiments. Statistical significance was determined by either two-way ANOVA with Bonferroni post-test or one-way ANOVA with Bonferroni post-test. *P ≤ 0.05, ***P ≤ 0.001.
