Fig. 6.
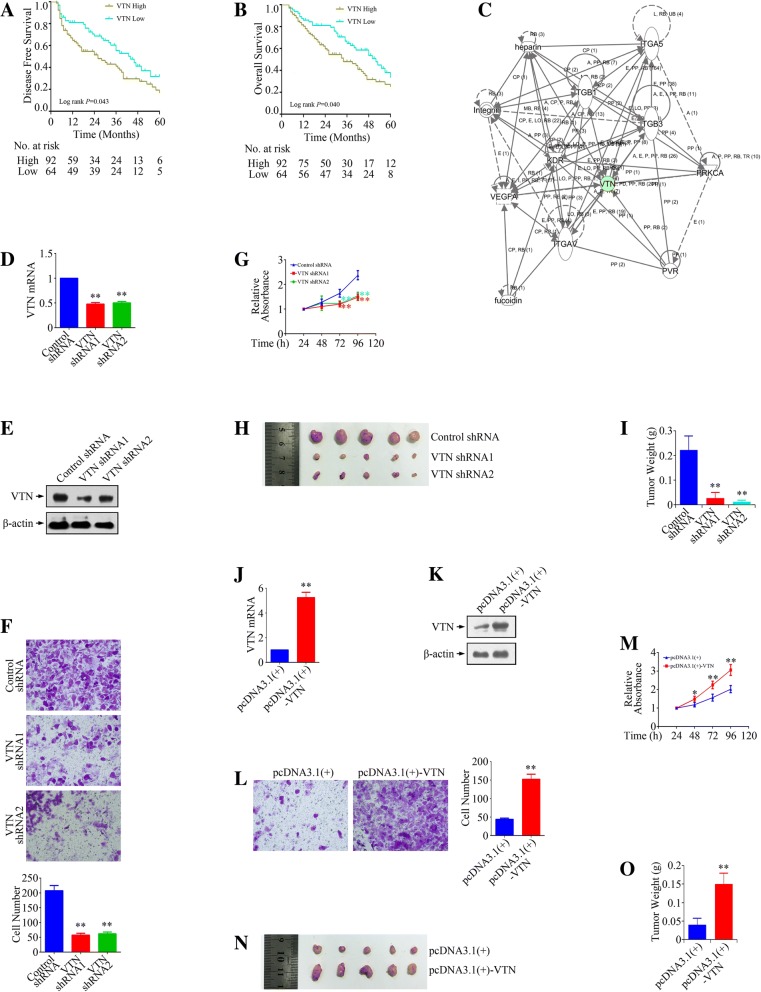
The effect of VTN on the growth and metastasis of gastric cancer cells. a & b Disease-free survival (DFS) and Overall survival (OS) of 156 gastric cancer patients according the VTN status. c Analysis of network regarding to VTN using IPA. d & e Confirmation of VTN knockdown in MKN-45 cells by using Real-time PCR and Western blot analysis. f The effect of VTN silencing on the invasion of MKN-45 cells. g The effect of VTN knockdown on the growth of MKN-45 cells in vitro. h Optical images of MKN-45 xenograft tumors. Tumors were dissected out 20 days after cell injection. i Tumor weight of MKN-45 xenograft tumors. j & k Confirmation of VTN overexpression in SCH cells by using Real-time PCR and Western blot analysis. l The effect of VTN overexpression on the invasion of SCH cells. m The effect of VTN overexpression on the growth of SCH cells in vitro. n Optical images of inoculated SCH tumors. Tumors were dissected out 20 days after cell injection. o Tumor weight of inoculated SCH tumors. *P < 0.05, **P < 0.01, significant differences vs. the respective control groups

