Fig. 7.

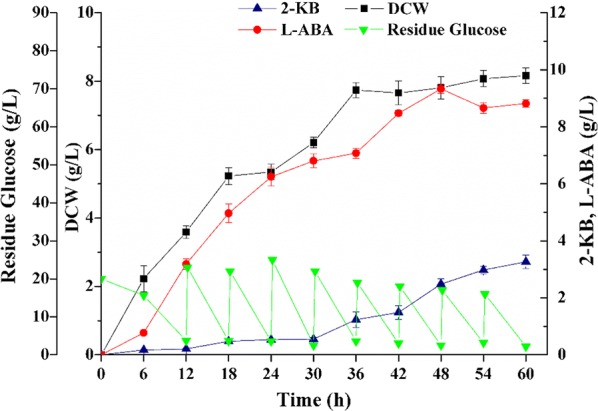
Fermentation process profiles of E. coli THR ΔrhtAΔilvIH/Gap-ilvA*-Pbs-leuDH showing DCW (filled squares), residual glucose (filled inverse triangle), 2-KB titer (filled upright triangle) and l-ABA titer (filled circles)

Fermentation process profiles of E. coli THR ΔrhtAΔilvIH/Gap-ilvA*-Pbs-leuDH showing DCW (filled squares), residual glucose (filled inverse triangle), 2-KB titer (filled upright triangle) and l-ABA titer (filled circles)