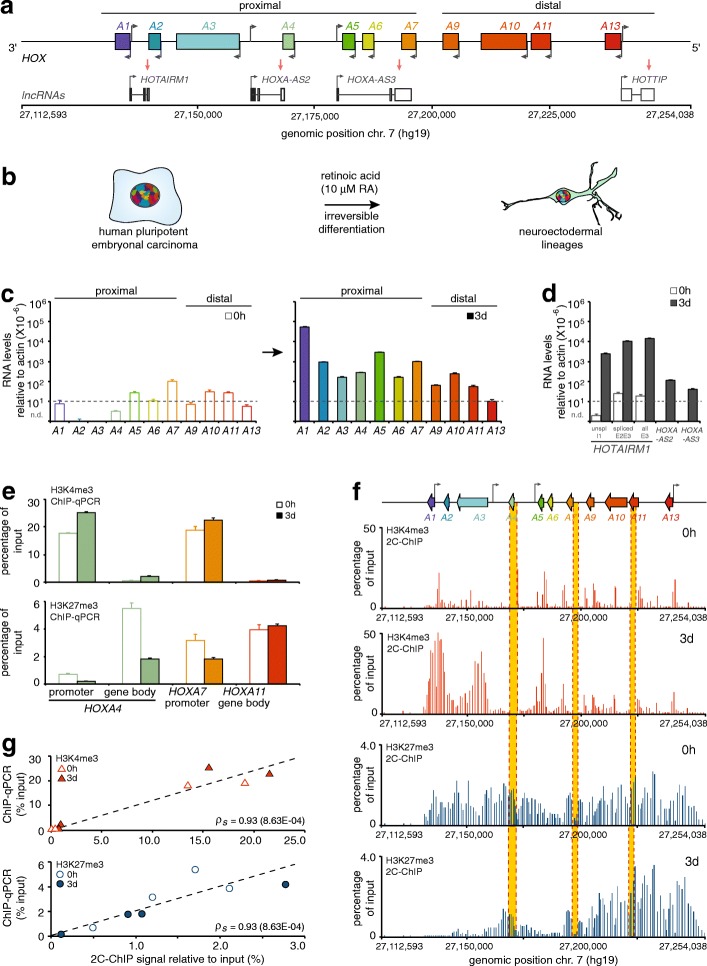
Fig. 2.
Results of 2C-ChIP analysis at the HOXA gene cluster correlate well with corresponding ChIP-qPCR data. a Schematic representation of the HOXA gene cluster included in the genomic region characterized in this study. The protein-coding HOXA genes are represented by rectangles with left-facing arrows to indicate gene orientation. Grey arrows pointing to the right show the transcriptional start site positions of long non-coding RNAs (lncRNAs) transcribed from the opposite strand. b Cell differentiation system used to develop and optimize the 2C-ChIP technique. Proximal HOXA (c) and lncRNA (d) genes are induced with RA. Steady state transcript levels measured by RT-qPCR are shown in (c) before (0 h; left), and after (3 days; right) cell treatment with 10 μM RA. LncRNA levels (d) are presented on the same graph. The y-axis shows RNA levels relative to actin where dashed lines indicate values below which measurements are unreliable. All RNA measurements are from at least three PCRs in each of two biological replicates (Additional file 2: Table S2). Error bars represent standard deviations. e ChIP-qPCR analysis of H3K4me3 and H3K27me3 changes occurring at select HOXA genes upon a 3-day RA treatment. Primer sequences are shown in Additional file 3: Table S3, and regions probed are highlighted in yellow in panel f. Error bars are standard deviations from at least 3 PCRs. f 2C-ChIP analysis of H3K4me3 and H3K27me3 at the HOXA gene cluster before and upon RA treatment for 3 days. Data shown here is limited to the region encoding genes and excludes most of the surrounding negative controls. Complete BED files are in Additional file 6: BED file 1–4. g Correlation between ChIP-qPCR results and corresponding 2C-ChIP signals for H3K4me3 and H3K27me3 ChIPs in uninduced and 3-day RA-induced NT2-D1 cells (Spearman’s rho = 0.93 for both assays)

