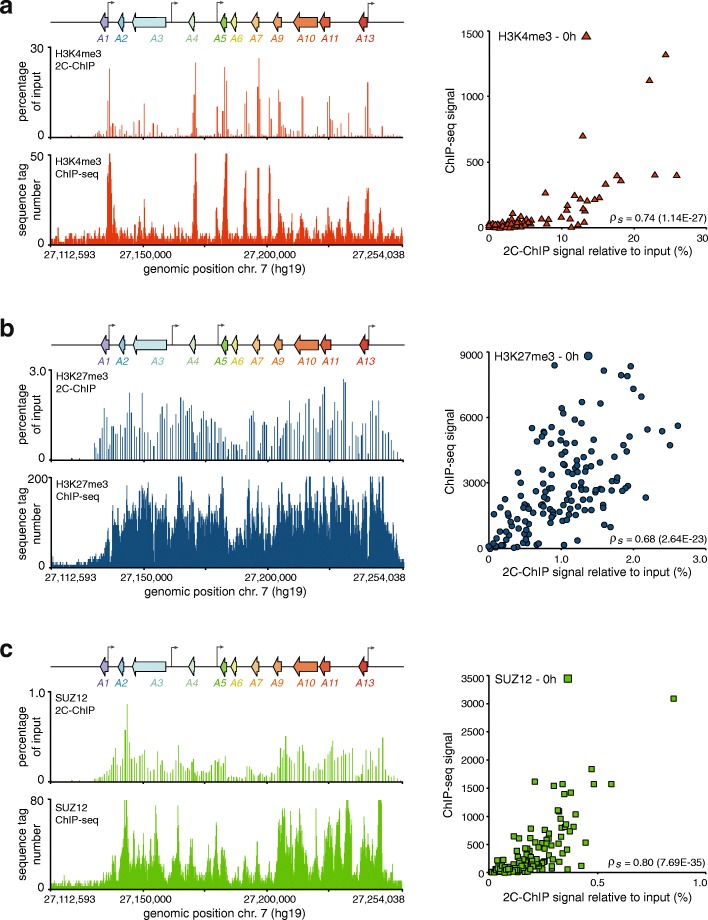
Fig. 3.
2C-ChIP and ChIP-seq results correlate well at the HOXA gene cluster. 2C-ChIP and ChIP-seq analysis of H3K4me3 (a), H3K27me3 (b), and SUZ12 (c) over the cluster region. Tracks seen on the left are limited to the gene-encoding region to highlight comparable detection of peaks and valleys by each assay. Complete 2C-ChIP BED files that include surrounding negative controls are in Additional file 6: BED file 1, 3, and 5. Correlation between 2C-ChIP and ChIP-seq results is found on the right of each panel and is between regions featured in both assays, excluding measurements equal to zero. Spearman’s rho is indicated on the bottom right of each graph

