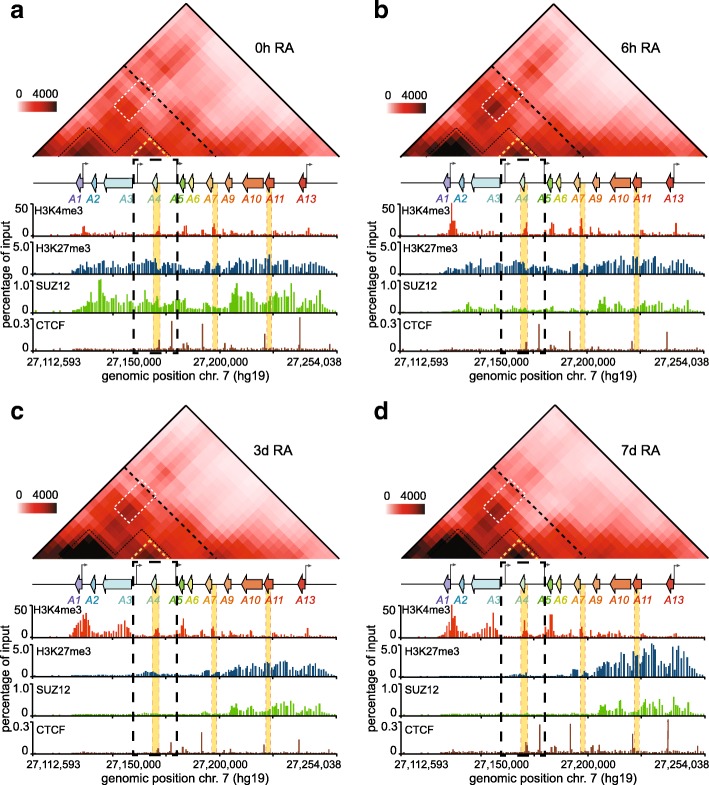
Fig. 5.
RA triggers extensive conformational changes at the HOXA cluster, including within a proximal subdomain where the H3K27me3 signal lingers. (a-d) The frequency of physical contacts along the HOXA cluster region is measured by 5C-seq in uninduced (a, 0 h RA; Additional file 13: 5C dataset 1), and in cells induced with RA for 6 h (b, 6 h RA; Additional file 13: 5C dataset 2), 3 days (c, 3d RA; Additional file 13: 5C dataset 3), or 7 days (d, 7d RA; Additional file 13: 5C dataset 4). 5C libraries were prepared with samples matched to set B. Pairwise interaction frequencies (IFs) are presented in heatmap format (10 kb bins, 10 kb smoothing, 2x steps) according to the color scale on the left of each panel. The HOXA cluster region is aligned to scale between each heatmap, and its corresponding 2C-ChIP tracks. The area boxed in dashed black lines within each panel highlights the region where H3K27me3 is cleared more slowly. Within heatmaps, the black dashed lines separating the proximal and distal genes indicate the TAD boundary identified previously [37]. The two main proximal subdomains found in uninduced (a, 0 h RA) cells are outlined in dashed black lines, and featured in the other panels as visual aids to follow conformational changes. The white boxes show long-range interactions between proximal genes. The subdomain outlined with yellow dashed lines highlights the region where H3K27 demethylation is slow. The areas shaded in yellow along the tracks identify regions characterized by ChIP-qPCR in Additional file 10: Figure S4

