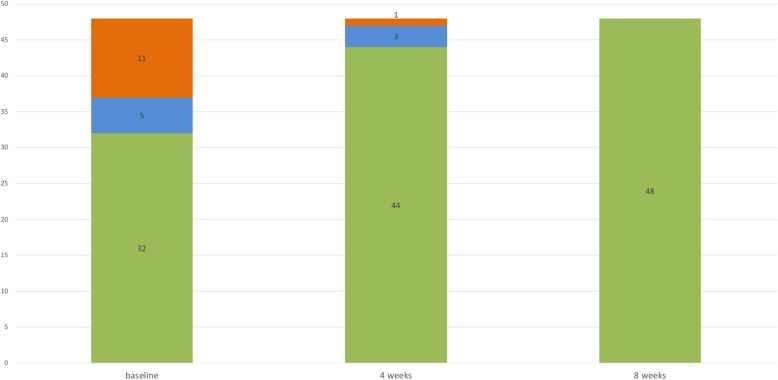
Fig. 3.
Distribution of patients (n = 48) according to their signs and symptoms at baseline (visit 1), after 4 (visit 2) and 8 weeks (visit 3). Individuals were assigned to the following groups and treated as described in the Methods section: neither itch nor signs (group I, green parts of columns), itch without skin lesions (group II, blue parts of columns), itch and skin lesions (group III, red parts of columns). Figures in columns represent numbers of patients of each group at the different time points

