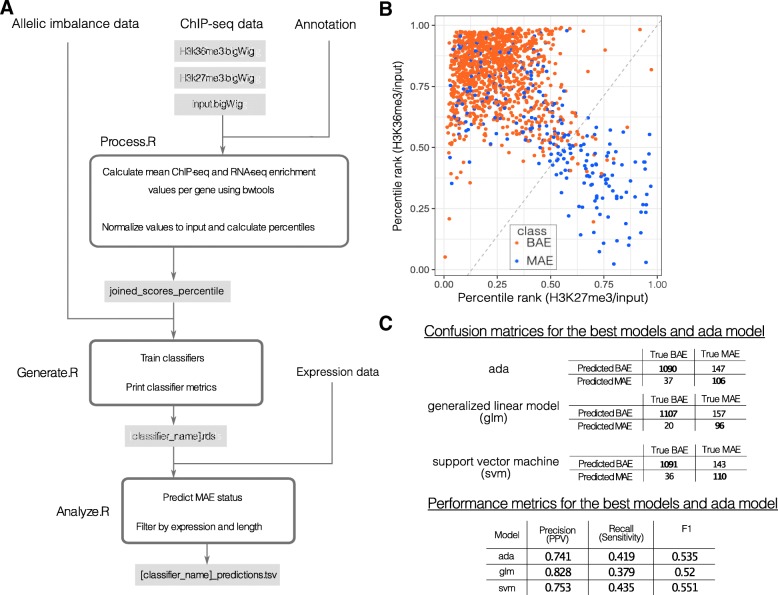
Fig. 1.
The MaGIC 2.0 pipeline and evaluation of glm performance. a Process.R calculates ChIP-seq enrichment per gene from ChIP-seq and control bigWig files. Generate.R trains classifiers using ChIP-seq enrichment and true MAE/BAE calls. Analyze.R uses classifiers to predict MAE/BAE gene status from ChIP-seq data. b Chromatin signature space of classifier features (H3K27me3 vs. H3K36me3) with the glm’s decision boundary plotted (dashed line) with MAE status of true labeled testing data (MAE: blue, BAE: red). c Confusion matrices and performance metrics for the selected models evaluated on additional testing data (glm and svm are selected as the best models based on the precision and the recall; ada model is presented for comparison reasons as the closest to the model in [11])

