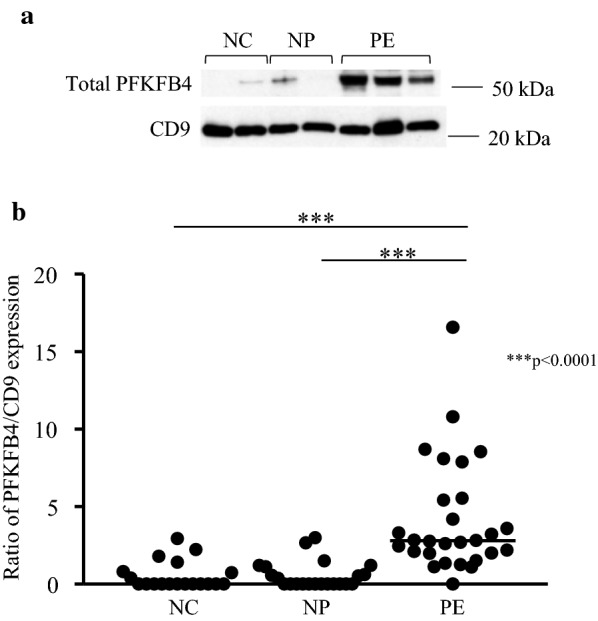
Fig. 4.

Expression of PFKFB4. a Shows Western blots obtained by immunoblotting antibodies directed against total PFKFB4 and CD9 protein. b Shows the 7.2-fold increase in PFKFB4 expression, represented as a ratio of PFKFB4 to CD9 levels. Data is represented in as a scatter plot, with each individual patient densitometry value represented as a dot, with the horizontal line representing the median
