Fig. 1.
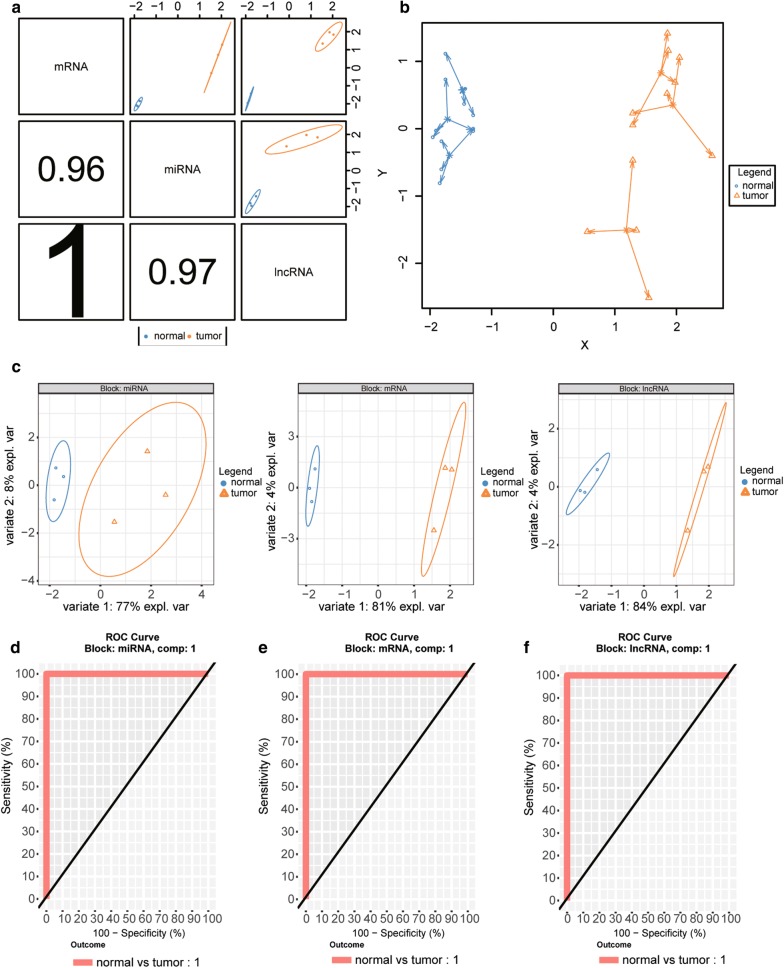
Partial least squares discrimination analysis with DIABLO. a Sample scatterplot from plotDiablo displaying the first component in each data set (upper diagonal plot) and Pearson correlation between each component (lower diagonal plot). b Arrow plot representing each sample pointing towards its outcome category. c The PLS-DA sample plots. d–f The ROC curve for miRNA (d), mRNA (e), and lncRNA (f) respectively

