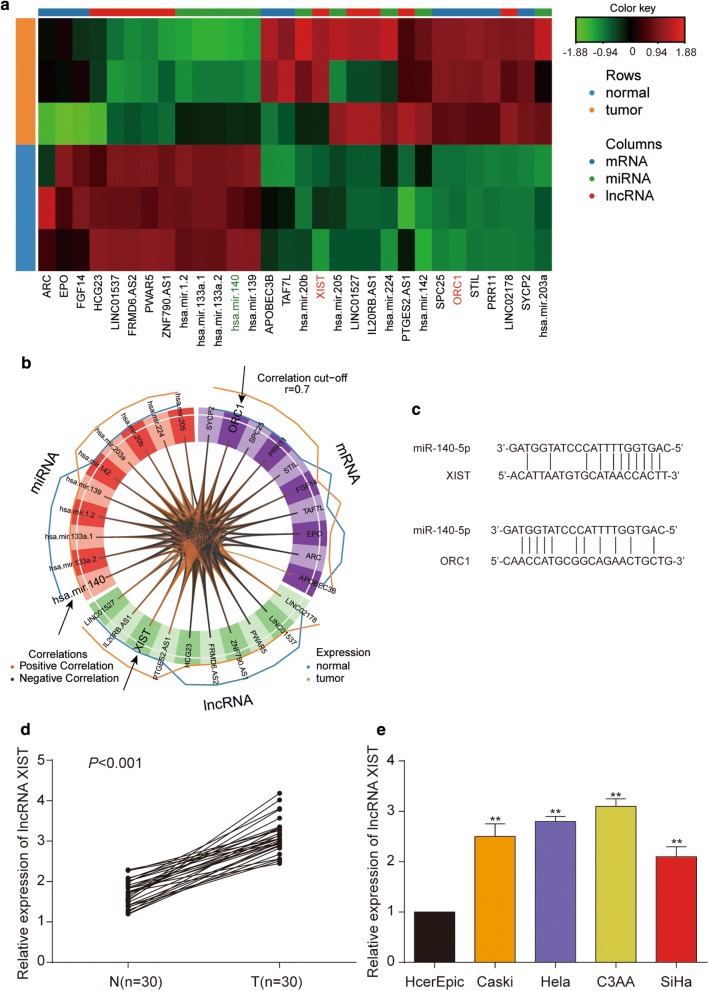
Fig. 2.
DIABLO graphical outputs on the cervical cancer study. a Clustered Image Map (Euclidean distance, Complete linkage) of the multi-omics signature. Samples are represented in rows, selected features on the first component in columns. b Circos plot shows the positive (negative) correlation (r = 0.7) between selected features as indicated by the brown (black) links, feature names appear in the quadrants. c The target relationships between XIST and miR-140-5p as well as miR-140-5p and ORC1 were predicted by starBase. d The expression of XIST was determined by qRT-PCR in 30 pairs of cervical cancer tissues (T) compared with adjacent non-tumor tissues (N), which was verified statistical significance by t-test. “n” indicates sample number. e The expression of XIST was examined by qRT-PCR in four cervical cancer cell lines (CaSki, HeLa, C3AA, SiHa) and human cervical epithelial cell line HcerEpic, **P < 0.01, compared with HcerEpic cell line

