
Fig. 1.
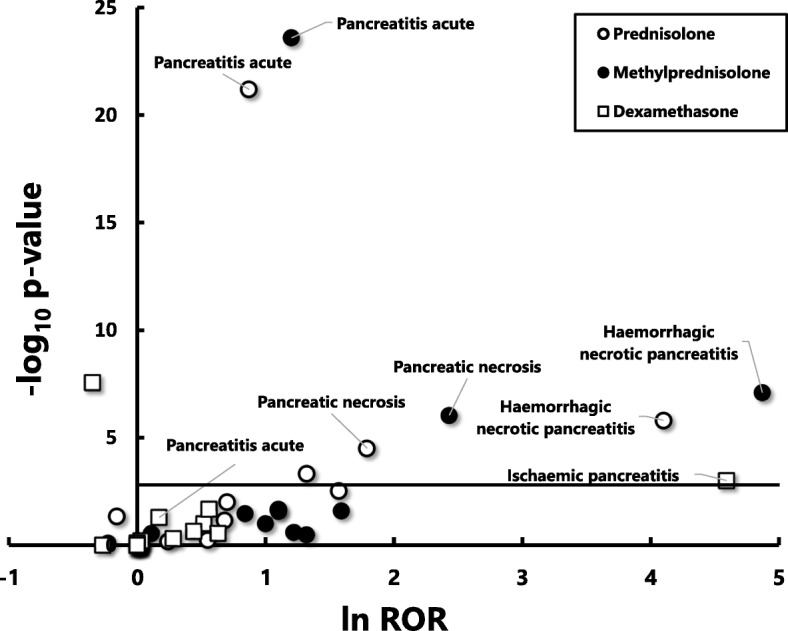
A volcano plot for visualizing statistical significance (p-values) and the magnitude of alarm signals (reporting odds ratios; RORs) for 18 PTs that were used for detecting the development of acute pancreatitis (SMQ) during the administration of prednisolone, methylprednisolone and dexamethasone. RORs were calculated using the reported data including all levels of reporters’ certain about the causality
Negative common logarithm (to the base 10) of p-values (−log10 P) are plotted on the y-axis and natural logarithm (to the base e) of RORs (ln ROR) are plotted on x-axis. The horizontal line represents the threshold of significance (p = 0.05) corrected for multiple comparisons by Bonferroni’s method (p = 0.00093)