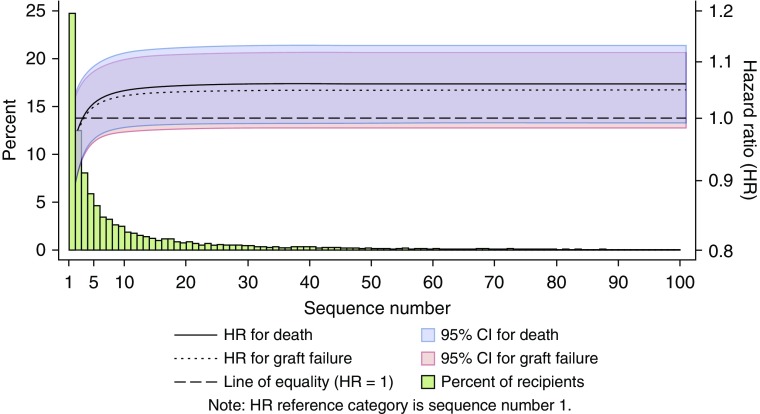
Figure 5.
Unadjusted fractional polynomial hazard ratio (HR) estimate for death and graft failure for the sequence number at the time of lung offer acceptance relative to sequence number 1. Offer acceptances above sequence number 100 were included in the analysis but not visualized to support readability as the HR estimates do not change. The histogram indicates the percent of offer acceptances at each sequence number out of all 10,981 acceptances included in the analysis. For example, 24.7% of all offers were accepted on the first offer, and 12.5% were accepted on the second offer. CI = confidence interval.

