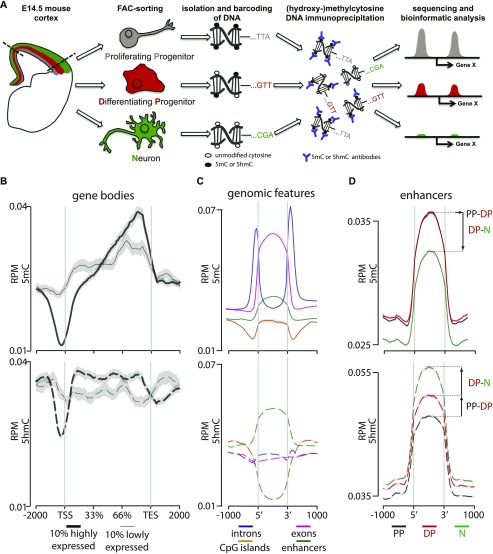
Figure 1. Cell type–specific assessment of 5(h)mC.
(A) Drawing depicting the strategy of our study with PP, DP, and neurons (color coded in gray, red, and green, respectively, throughout all figures) FAC-sorted from the E14.5 mouse cortex followed by DNA barcoding, mixture, immunoprecipitation, and sequencing. (B–D) Distribution and abundance (reads per million = RPM) of 5(h)mC of the ±2,000-bp regions across gene bodies of the top 10% more highly or lowly expressed genes (B; thick and thin lines, respectively); genomic regions (C, as indicated); or enhancers in PP, DP, and neurons (D, as indicated). Note that in this and all other figures, 5mC and 5hmC are consistently depicted as continuous (top) or dashed (bottom) lines, respectively. Values for the three cell types were merged together (B, C) or depicted individually (D). Note the characteristic drop in 5(h)mC at the TSS and TES (B) and the bivalent 5(h)mC signatures within enhancers during neurogenic commitment (D). Gray shadows in B represent the standard error of the mean, which was too small to be visibly depicted in (C, D) because of the much higher number of loci in the latter relative to the former plots.

