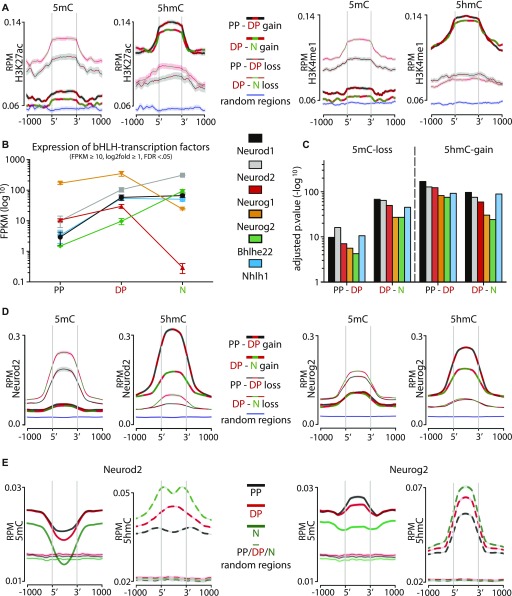
Figure 3. 5mC-loss/5hmC-gain loci are enriched in active enhancers and pioneer factor–binding motifs.
(A) Distribution and abundance (RPM) of active enhancer marks including H3K27ac (left) or H3K4me1 (right) as depicted across a ±1-kb region of loci undergoing differential (hydroxy-)methylation. For these plots, all eight possible combinations were considered, namely, gain (thick lines) or loss (thin lines) in 5mC (left) or 5hmC (right) in the PP–DP (black/red lines) or DP–neuron (red/green lines) transition as well as random loci as negative controls (blue lines). Note the increase in both histone marks sharply at the 5′ and 3′ end of 5mC-loss/5hmC-gain, but not 5mC-gain/5hmC-loss, loci (heat maps are also shown in Fig S3A to appreciate individual loci). ChIP-Seq data for H3K27ac and H3K4me1 from the E14.5 mouse cortex were taken from the ENCODE project (Shen et al, 2012). Shadows represent the variance (SD) of the mean that in some cases was too small to be visibly depicted. (B, C) Expression levels (FPKM) of bHLH transcription factors up-regulated from PP to DP (B), and enrichment values of their binding motifs within 5mC-loss/5hmC-gain loci (C) (top five motifs are shown in Fig S3B). (D) Distribution and abundance (RPM) of Neurod2 and Neurog2 ChIP-Seq reads across a ±1-kb region including loci undergoing any of the eight possible combinations of differential (hydroxy-)methylation depicted as in A and including random loci as negative control (variance was too small to be depicted). (E) Converse analysis as in (D) with distribution and abundance (RPM) of 5(h)mC reads of PP (black), DP (red), N (green) plotted across Neurod2 (left)– and Neurog2 (right)–binding sites (bold) and random regions as negative control (left and right; thin lines).

