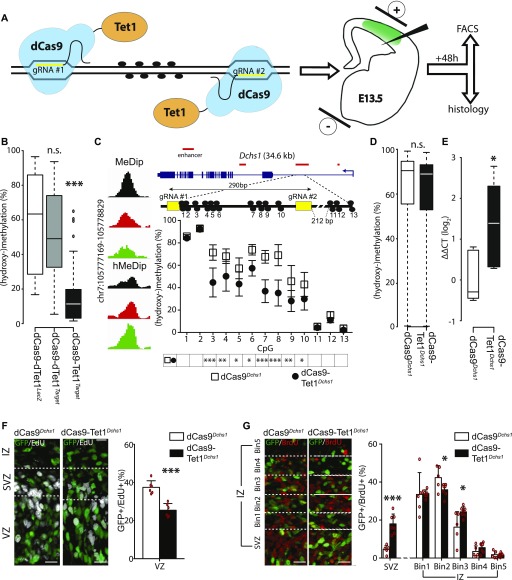
Figure 4. Site-specific manipulation of (hydroxy-)methylation.
(A) Drawing depicting dCas9-Tet1 targeting of a locus of interest through the use of two gRNAs (yellow) to manipulate 5(h)mC at CpG dinucleotides (black circles) by in utero electroporation (right) of a vector including all components of interest plus GFP as reporter. (B) Whiskers–box plots depicting 5(h)mC levels of FAC-sorted GFP+ cells 48 h after in utero electroporation as assessed by bisulfite sequencing of 48 cytosines within four loci (individual loci and values are shown in Fig S4A). Note the major reduction in 5(h)mC upon use of dCas9-TetTarget constructs. (C) Screenshot of 5(h)mC levels in cell types (left) and drawing (in scale) of the Dchs1 locus and regions targeted by dCas9-TetDchs1 vectors (top). Assessment of 5(h)mC in GFP+ cells 48 h after in utero electroporation was performed as described in Figs 4B and S4A (bottom). (D) Whiskers–box plots depicting 5(h)mC levels assessed by bisulfite sequencing at top 10 predicted off-target regions (5 for each gRNA, 51 CpGs total) of FAC-sorted GFP+ cells 48 h after in utero electroporation of dCas9-TetDchs1 or dCas9Dchs1. (E) Dchs1 expression levels (ΔΔCT) calculated by qRT–PCR on GFP+ cells as described in (C). Note the ∼2.5-fold increase expression upon demethylation. (F, G) Pictures of the E15.5 mouse cortex (left) and quantifications (right) 24 h after electroporation under different conditions followed by (immuno-)labeling for GFP, EdU, or BrdU (as indicated). Boundaries of the SVZ with the VZ and IZ were assessed by Tbr2 staining (not shown) or equidistant bins through the IZ are indicated (dashed lines in E and F, respectively) in which GFP+ cells were expressed as proportion of their total number. Scale bar = 50 μm; bars = SD (SEM in C); n ≥ 6 (E and F); statistical test = t test; *P < 0.05; **P < 0.01; ***P < 0.001.

