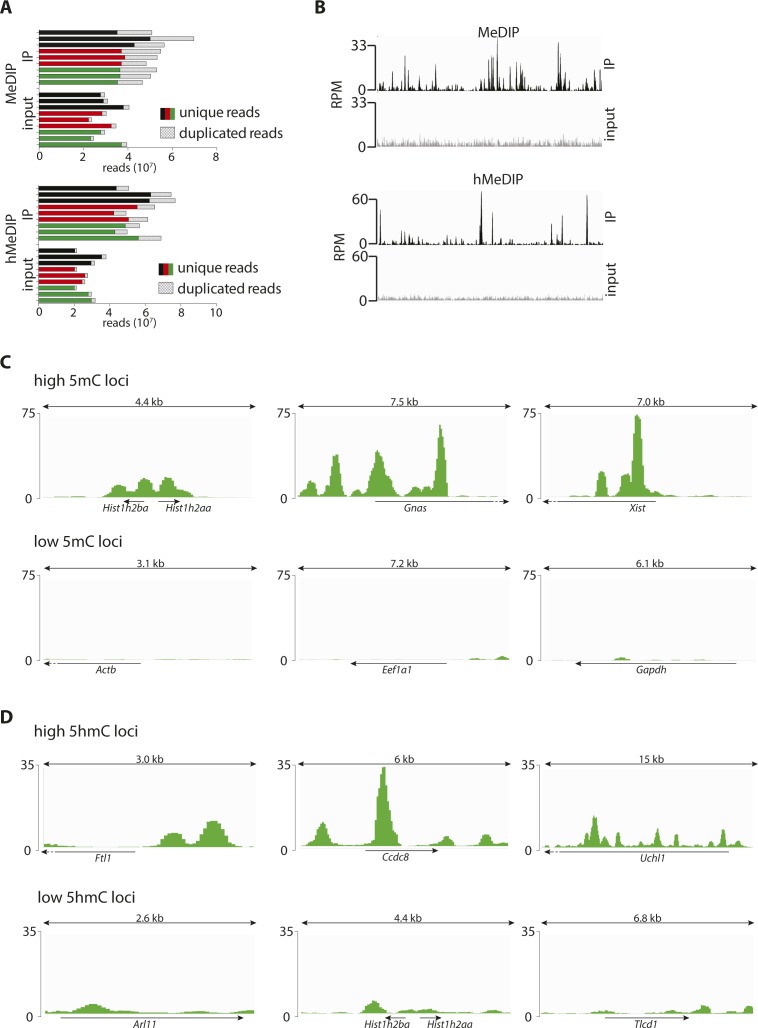
Figure S1. 5(h)mC patterns across control loci.
(A) Number of reads (unique/duplicated as indicated) per biological replicate of PP (black), DP (red), and N (green) upon MeDIP (top) or hMeDIP (bottom). (B) Signal distribution across a 1-Mbp region for the merged (all cell types and replicates) immunoprecipitated samples (black) and merged input controls (gray) of MeDIP (top) and hMeDIP (bottom). Note the different peak patterns indicating no detectable cross-reactivity. (C, D) Screenshots (IGV browser) of 5mC (C) or 5hmC (D) profiles in neurons (merged triplicates) representing three known examples of high (top) or low (bottom) (hydroxyl)methylated loci. Scale = normalized coverage.

