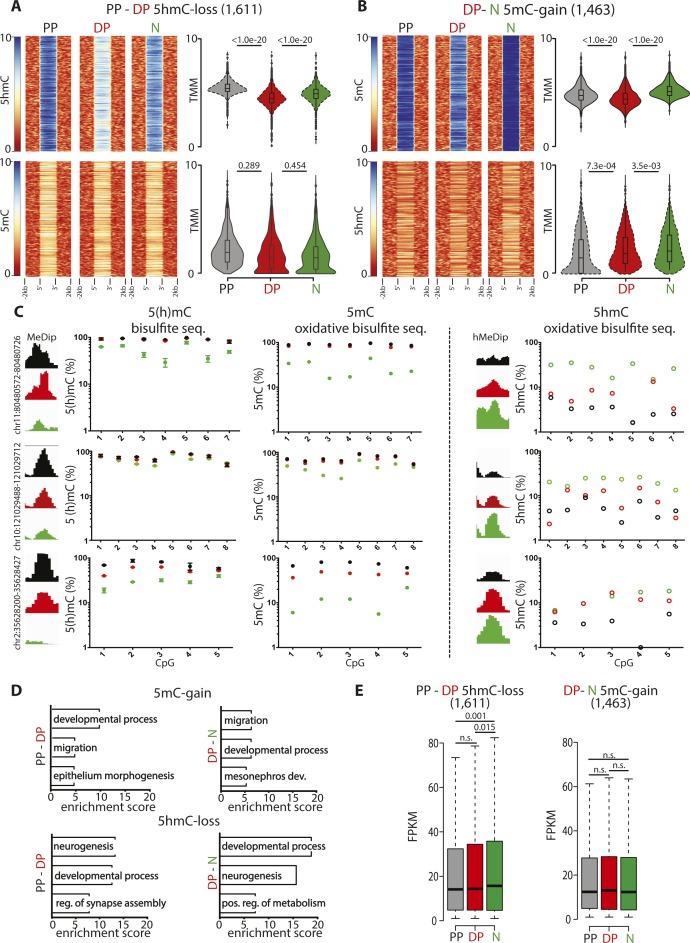
Figure S2. Validation and features of differentially (hydroxy-)methylated loci.
(A, B) Heat maps (left) and violin plots (right) representing 5(h)mC levels within a ±2-kb region across differentially (hydroxy-)methylated loci in each cell type (colors, as indicated) and equivalent to Fig 2B and C but considering 5mC-gain/5hmC-loss loci in DP (1,611) or neurons (1,463) rather than the converse 5mC-loss/5hmC-gain loci and revealing the specificity in correlation of the latter but not the former modifications. (C) Distribution of (h)MeDip reads across selected regions showing differential (hydroxy-)methylation and validation at single-nucleotide resolution by (oxidative) bisulfite amplicon sequencing as indicated by each panel. (D, E) DAVID-gene ontology term enrichment (top three) (D) and whiskers–box plots of expression levels (FPKM) (E) of genes containing, or in proximity 5mC-gain/5hmC-loss loci complementary to the converse 5mC-loss/5hmC-gain loci shown in Fig 2E and F and showing the poor GO specificity and lack of correlation. Error bars in (C), left = SD; n = 3. Statistical test = Wilcoxon rank sum test (A, B, and E).

