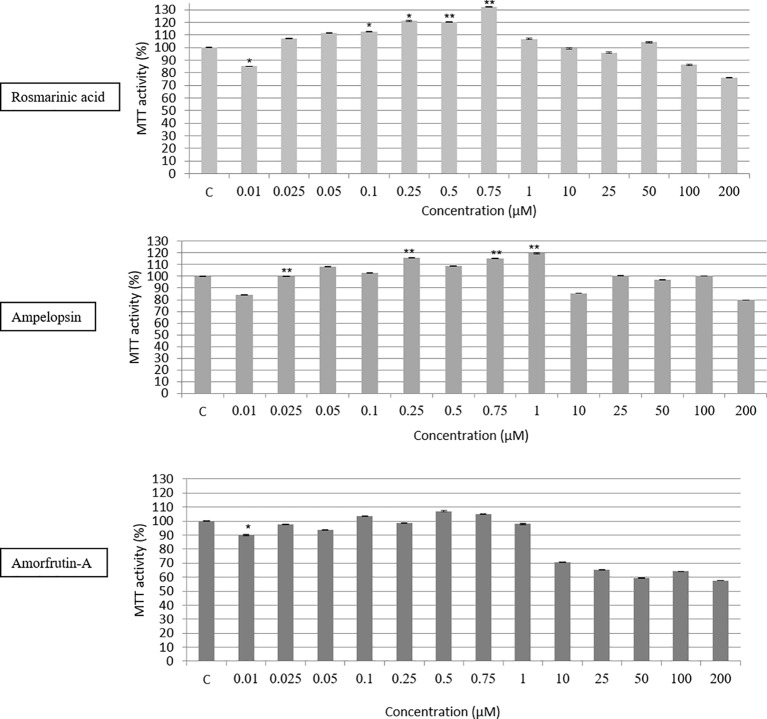
Figure 2.
Dose response testing (between 0.01 and 200 μM) of ROSM, AMPEL, and AMOR on the metabolic activity and survival of early passage PCS cells (p17), as determined by the MTT assay. The bars indicate the ±SD; n = 6, in terms of independent wells; **p < 0.01, *p < 0.05, as determined by Student’s t-test.

