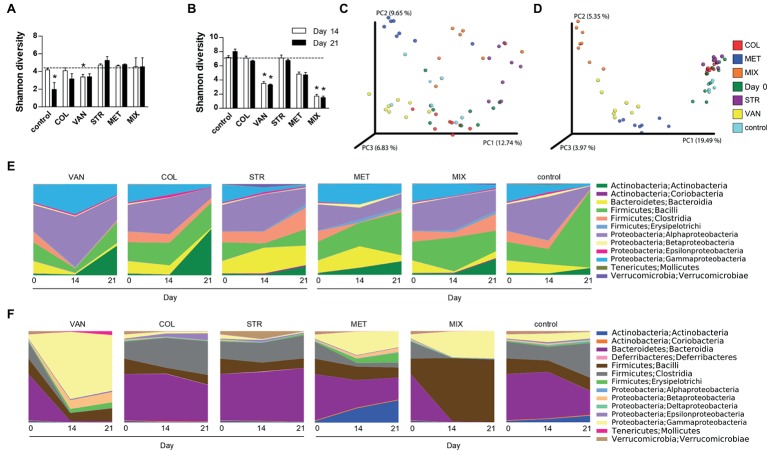
Figure 3.
Antibiotic treatment caused extensive shifts in microbial communities in the intestine but not on the skin. Differences in bacterial diversity in the skin (A) and intestine (B) among the groups treated with antibiotics and the control group of mice expressed by Shannon diversity index. Dashed line is background of bacterial diversity at Day 0. Data represent means ± SD from the pool of either 4–5 mice (Day 14) or 3 mice (Day 21) in each group. Statistical significance was determined by unpaired Student’s t-test; *p < 0.05 and **p < 0.01. Principal coordinates analysis (PCoA) plot using the unweighted UniFrac distance metric compares the compositional similarity between all tested groups in the skin (C) and intestine (D). Groups are color-coded and each point represents one mouse. Statistical significance was confirmed using PERMANOVA. Time-dependent changes in microbial composition on the skin (E) or in the intestine (F). Relative bacterial abundances are shown as a mean of group of either 7–10 mice (Day 0), 4–5 mice (Day 14), or 3 mice (Day 21). COL, colistin; MET, metronidazole; VAN, vancomycin; STR, streptomycin; MIX, antibiotic mixture. Day 0 shows the composition of mouse microbiota at the beginning of the experiment, i.e. before antibiotics treatment (Day 0); Day 14 follows microbiota composition after two weeks of each antibiotic treatment (Day 14); and Day 21 shows microbiota after the induction of skin inflammation (Day 21).

