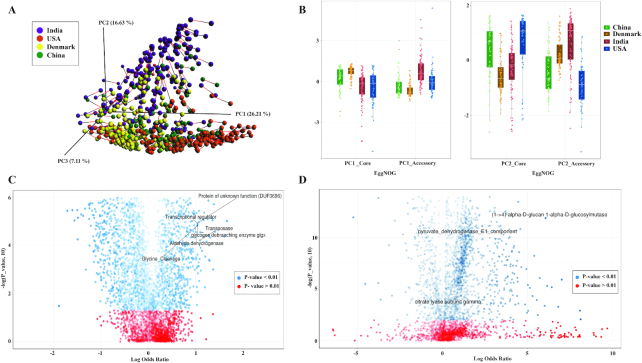
Figure 2:
Functional variations and differences between Indian populations and other populations determined from core and accessory microbial functions. (A) Procrustes analysis was performed on Bray Curtis distances calculated from core EggNOG and accessory EggNOG abundance tables in all populations. PCA analysis shows the concordance of core and accessory functions in India, Denmark, US, and China populations. The red and black lines are associated with core and accessory datasets, respectively. (B) Eigenvalues calculated from PCA of samples using core EggNOGs and accessory EggNOGs are plotted. The box plots showing for core and accessory eigenvalues for all samples in different populations are shown. Each box plot represents the median shown as white line between the boxes, the upper and lower ends of the boxes representing upper quartile (75th percentile) and lower quartile (25th percentile). The whiskers extending on both ends represent 2.5* interquartile range. The different colored dots overlaid for each sample are plotted over the box. The enrichment or depletion of (C) Eggnog and (D) Kegg functions in India compared to other populations are shown as volcano plots. The log-transformed FDR adj. P values calculated from negative binomial-based Wald test from DESeq2 are plotted on the x-axis. The log odds ratio calculated for India vs Other datasets are plotted on the y-axis. The EggNOGs/KOs with P value < 0.05 are shown in blue whereas those having P values>0.05 are shown in red. The EggNOGs/KOs extending on the right and left side and with P value>0.05 are labeled as highly enriched in India and other datasets, respectively.

