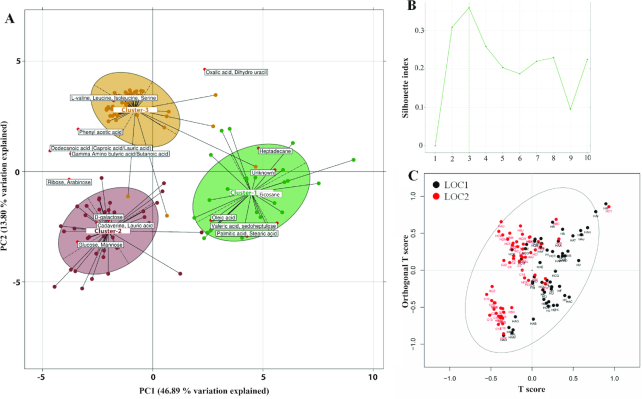
Figure 4:
Between-class analysis to identify metabotypes and their associated metabolites. (A) Metabolite clusters (MES) abundance profiles of samples were generated, and their clustering was performed using PAM (partitioning around medoids) clustering. The between-class and PCA of JSD distances and PAM clustering identified three clusters to be optimum for their segregation using (B) Silhouette index. The metabolites valeric acids and saturated fatty acids such as palmitic acid and stearic acid were found to be higher in Cluster1. The carbohydrates such as glucose and galactose were found to be higher in Cluster 2. The BCAAs, lauric acid, and butyric acid were found to be higher in Cluster 3. (C) OPLS-DA analysis using locations as classes shows locations as differentiating factors in separating the samples based on their metabolomic profiles.

