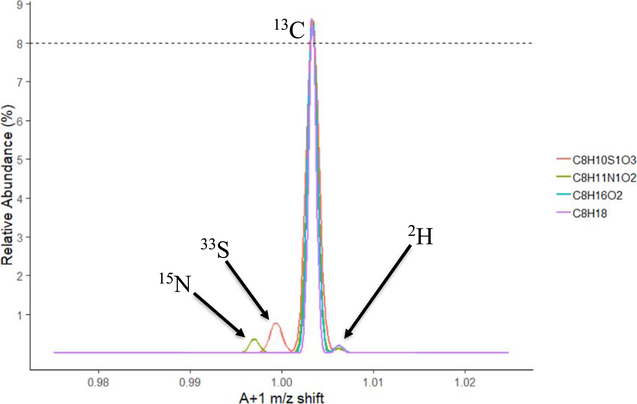
Figure 4.
Theoretical shift of the A+1 peaks for four organic molecules compared to the calculated value for a molecule containing only carbon and hydrogen. In each case, the spacing between the monoisotopic mass (relative abundance 100%) and the 13CA+1 peak shown is 1.003 35 Da, and the relative abundance at ~8% indicates eight carbons. Fine isotope structure from 2H, 1.006 28 Da, from 15N, 0.997 03 Da, and from 33S, 0.999 387 Da, can be observed with sufficient resolving power.

