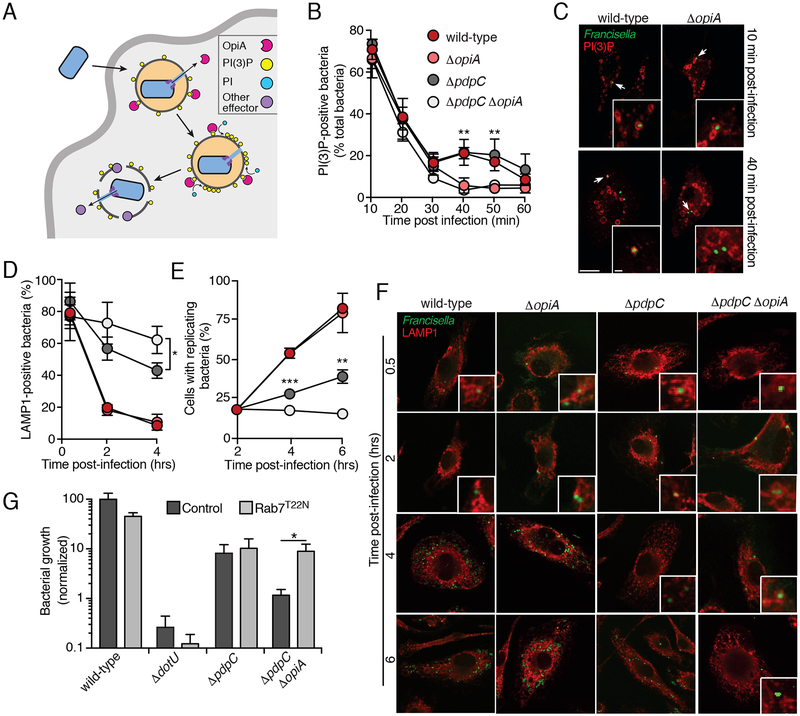
Figure 6.
OpiA-mediated alterations to phagosomal trafficking contributes to intracellular growth of F. novicida.
(A) Model depicting localization and hypothesized role of OpiA during intracellular replication. OpiA exported by the T6SSii binds to PI(3)P on the cytosolic face of the FCP, and facilitates accumulation of additional PI(3)P through phosphorylation of PI. We speculate that FCP lysis is then promoted by additional effectors secreted by the T6SSii.
(B) Proportion of F. novicida cells that co-localize with the PI(3)P probe mCherry-2xFYVE at the indicate times post infection of primary murine BMDMs. Data represent means ± s.d. of three independent experiments. Asterisks represent statistically significant differences (Two-way ANOVA with Sidak’s correction for multiple comparisons; **p ≤ 0.001).
(C) Representative images acquired at 10 and 40 min post-infection of the experiment described in (B) (PI(3)P, (red); GFP-expressing bacteria, green). Insets represent 2.3-fold magnification of the regions indicated by arrows. Scale bars, 10 μm and 1 μm (insets).
(D) Proportion of F. novicida cells that co-localize with the late endosomal marker LAMP1 at the indicated times post infection of primary murine BMDMs. Colors indicate strains tested as in panel B. Data represent means ± s.d. of three independent experiments. Asterisks represent statistically significant differences (One-way ANOVA with Tukey’s correction for multiple comparisons; *p ≤ 0.05).
(E) Proportion of infected macrophages that contained replicating bacteria (greater than 5 bacteria/cell) at the indicated times post-infection of primary murine BMDMs. Colors indicate strains tested as in panel B. Data represent means ± s.d. of three independent experiments. Asterisks represent statistically significant differences (One-way ANOVA with Tukey’s correction for multiple comparisons; **p ≤ 0.001,*** p ≤ 0.0001).
(F) Representative images acquired at indicated time post-infection of the experiment described in (D) and (E) (PI(3)P, (red); GFP-expressing bacteria, green). Insets represent 3-fold magnification of the regions indicated by arrows. When >5 bacteria present in cytosol, insets are not included. Scale bars, 10 μm and 1 μm (insets).
(G) Intracellular growth (16hrs post-infection) of the indicated F. novicida strains infecting HeLa cells transfected with empty vector or a construct to express Rab7T22N. Data represent means ± s.d. Asterisks indicate statistically greater replication in experimental treatments compared to vector-only controls (Student’s t-test; *p ≤ 0.05).

