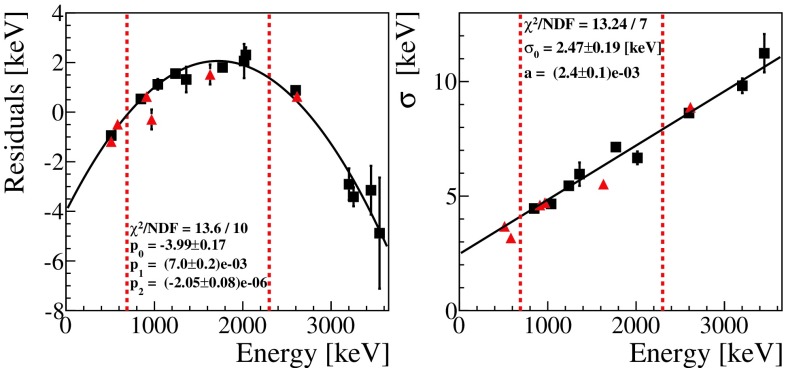
Fig. 2.
Validation of the calibration (red triangles) with a Co source (black squares). All the energy spectra of the ZnSe crystals were calibrated using the coefficients derived from the fit of the most prominent peaks. Left: residuals of the calibration, defined as (nominal energy - ), as a function of the energy; the data obtained with Co are modelled with a parabolic function (black line). Right: the energy resolution measured for different lines is shown as a function of the energy. Data reported in this plot are modeled with a linear function (see text). The vertical dashed lines indicate the region of interest

