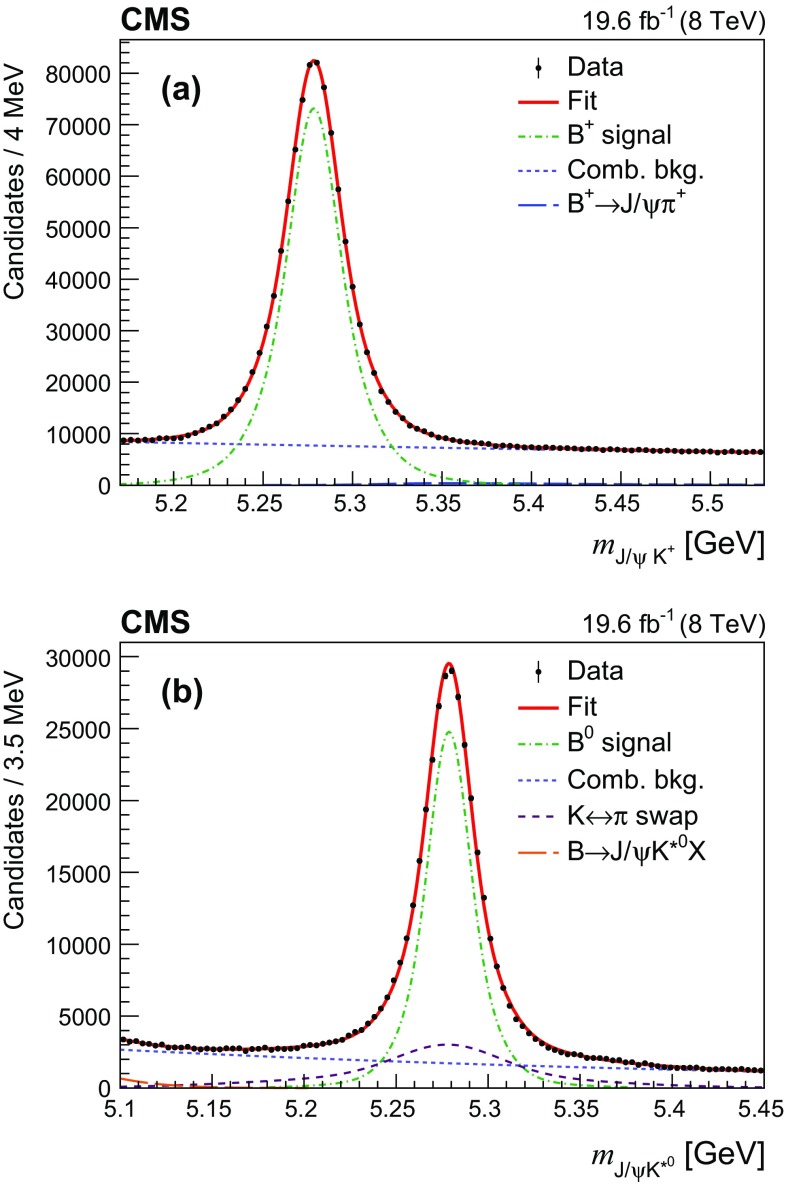
Fig. 1.
Invariant mass distributions of a and b candidates in data with the fit results superimposed. The points represent the data, with the vertical bars giving the corresponding statistical uncertainties. The thick curves are results of the fits, the dash-dotted lines display the signal contributions, and the short-dashed lines show the combinatorial background contributions. The long-dashed line shows in a the contribution from the decay, and in b the contribution from partially reconstructed decays. The dashed line in b displays the contribution from swapping in the reconstruction

