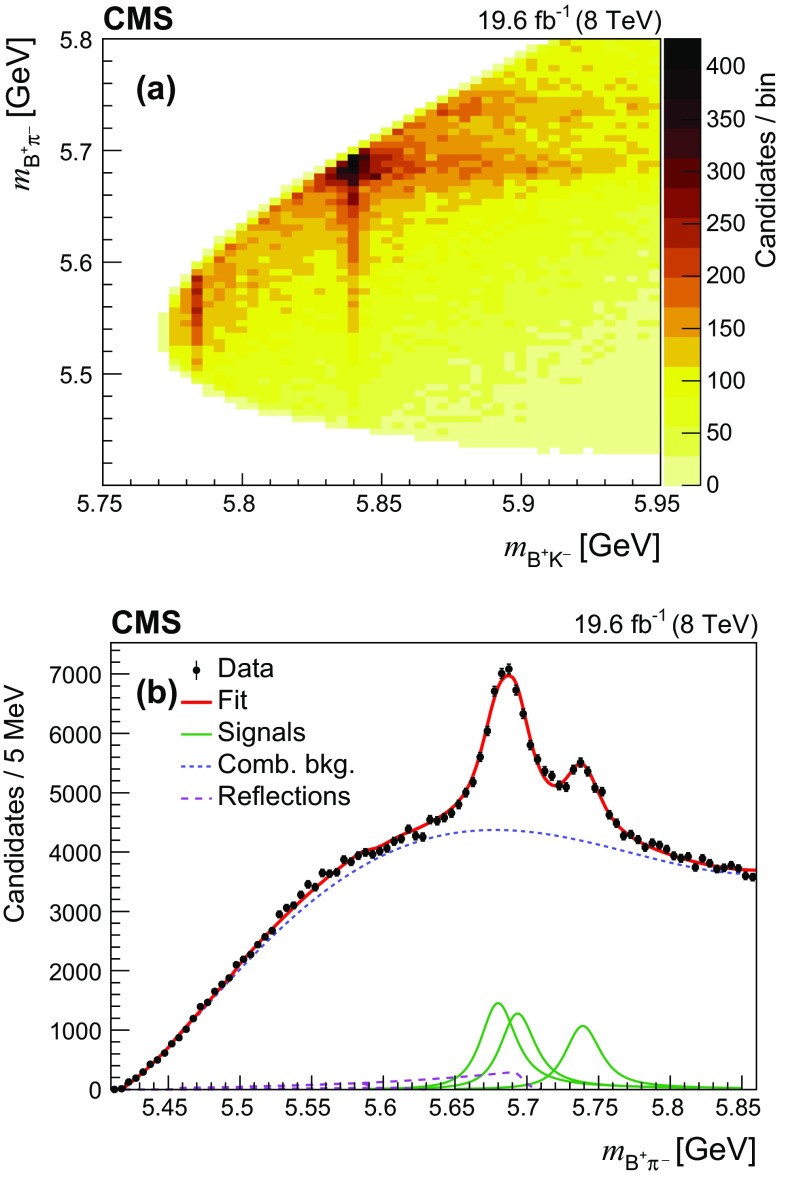
Fig. 2.
a Two-dimensional distribution of versus in data. b The fitted invariant mass distribution. The points represent the data, the thick solid curve is the fit projection, the thin lines indicate the three excited signal contributions, the short-dashed curve is the combinatorial background, and the long-dashed lines show the contributions from the excited decays

