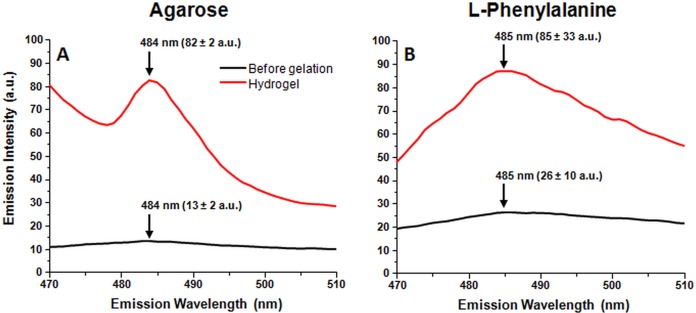
Figure 3. One percent agarose and 300 mM Phe gel formation induced ThT fluorescence emission changes (sample excitation wavelength – 440 nm).
Fluorescence emission intensity changes observed during one percent agarose (A) and 300 mM Phe (B) gel formation. Ten nm excitation and five nm emission slits were used. Emission intensity was calculated from three separate measurements.

